Fig. 9
Download original image
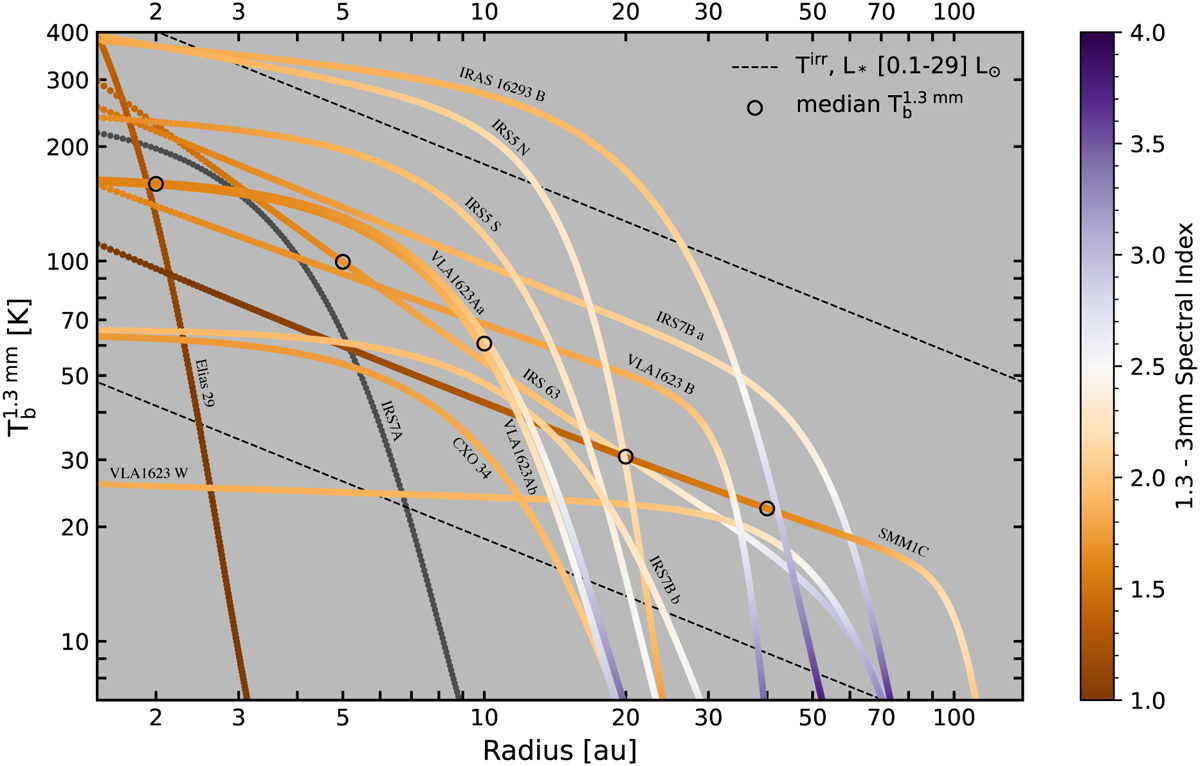
Intensity profiles at 1.3 mm for all disks resulting from either a Gaussian fit (for the most compact disks) or a modified self-similar profile fit (Section 5.1). The colors of the curves correspond to the resultant 1.3–3 mm spectral index at each radii, except RCrA IRS7A due to the non-dust emission at 3 mm (Appendix B). The circles show the median value for the brightness temperature at certain radii. The dashed lines correspond to the theoretical approximation for the midplane temperature due to irradiation (T ∝ r−0.5) considering the range of bolometric luminosities of the sample (see Section 5.5 for details).
Current usage metrics show cumulative count of Article Views (full-text article views including HTML views, PDF and ePub downloads, according to the available data) and Abstracts Views on Vision4Press platform.
Data correspond to usage on the plateform after 2015. The current usage metrics is available 48-96 hours after online publication and is updated daily on week days.
Initial download of the metrics may take a while.