Fig. 1.
Download original image
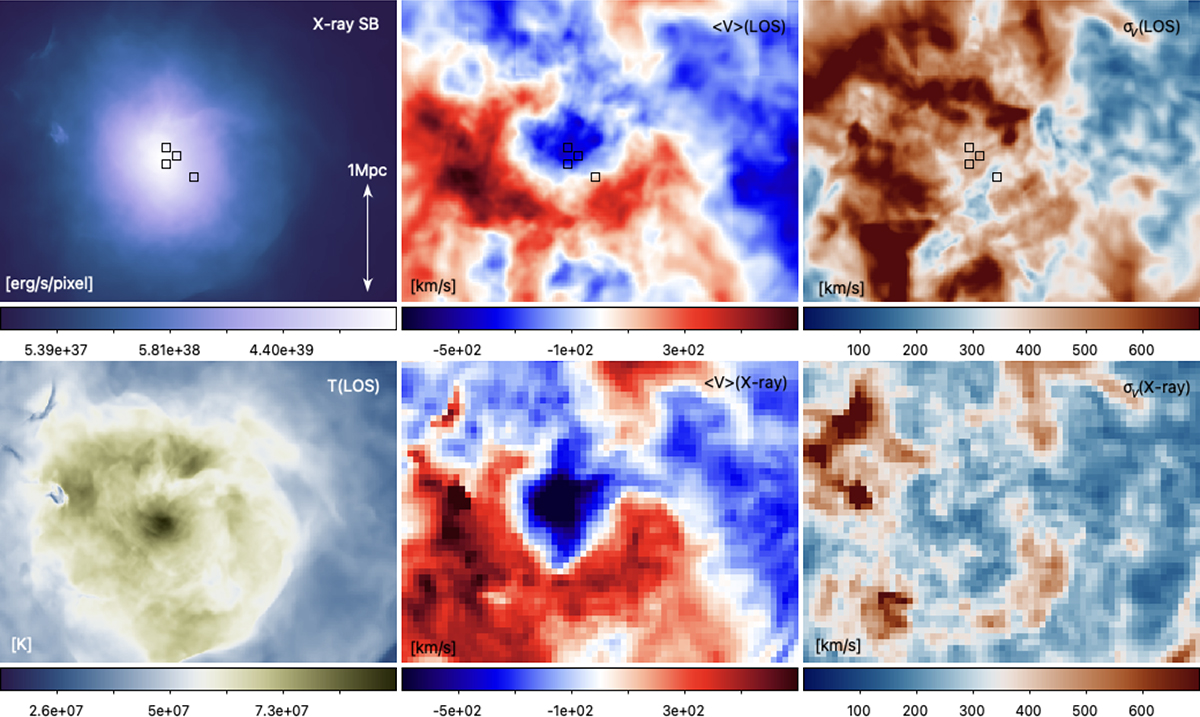
Projected X-ray surface brightness in the [5–7] keV energy range for our simulated cluster (top left), average X-ray weighted gas temperature (lower left), average gas velocity along the LOS, either using a volume-weighting procedure (top centre) or an X-ray emissivity weighting along the LOS, within pixels of 90 × 90 kpc2 to mimic XRISM’s field of view for Coma (bottom centre). Gas velocity dispersion along the LOS, again either using a volume-weighting procedure (top right) or an X-ray emissivity weighting along the LOS, for 90 × 90 kpc2 pixels (bottom right). The black squares refer to the regions used to produce the line emission profiles given in Fig. 3.
Current usage metrics show cumulative count of Article Views (full-text article views including HTML views, PDF and ePub downloads, according to the available data) and Abstracts Views on Vision4Press platform.
Data correspond to usage on the plateform after 2015. The current usage metrics is available 48-96 hours after online publication and is updated daily on week days.
Initial download of the metrics may take a while.