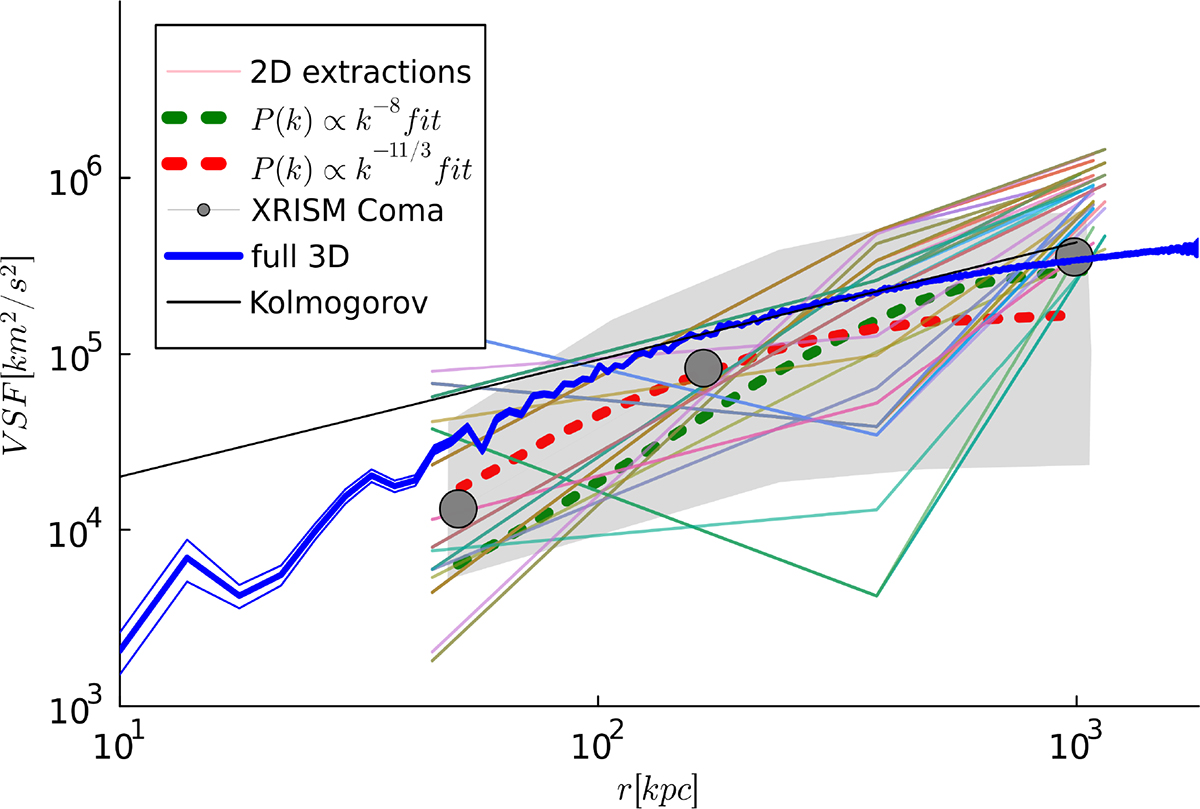
Fig. 2.
Download original image
Thin lines with different colours: simulated VSFs for 50 random LOSs, with an area of 90 × 90 kpc2, randomly extracted from our two-dimensional velocity map and with separations as in the XRISM observation of Coma. Blue lines: Full three-dimensional VSF for the velocity along the LOS component, using 107 cells in the cluster volume. The grey points are the XRISM measurements for Coma. The additional dashed lines show the best-fit models derived Xrism Collaboration (2025b) for a Kolmogorov spectrum (red) or a much steeper one (green), while the shaded grey area shows the 68% cosmic variance uncertainty and the measurement statistical errors in the same work.
Current usage metrics show cumulative count of Article Views (full-text article views including HTML views, PDF and ePub downloads, according to the available data) and Abstracts Views on Vision4Press platform.
Data correspond to usage on the plateform after 2015. The current usage metrics is available 48-96 hours after online publication and is updated daily on week days.
Initial download of the metrics may take a while.