Open Access
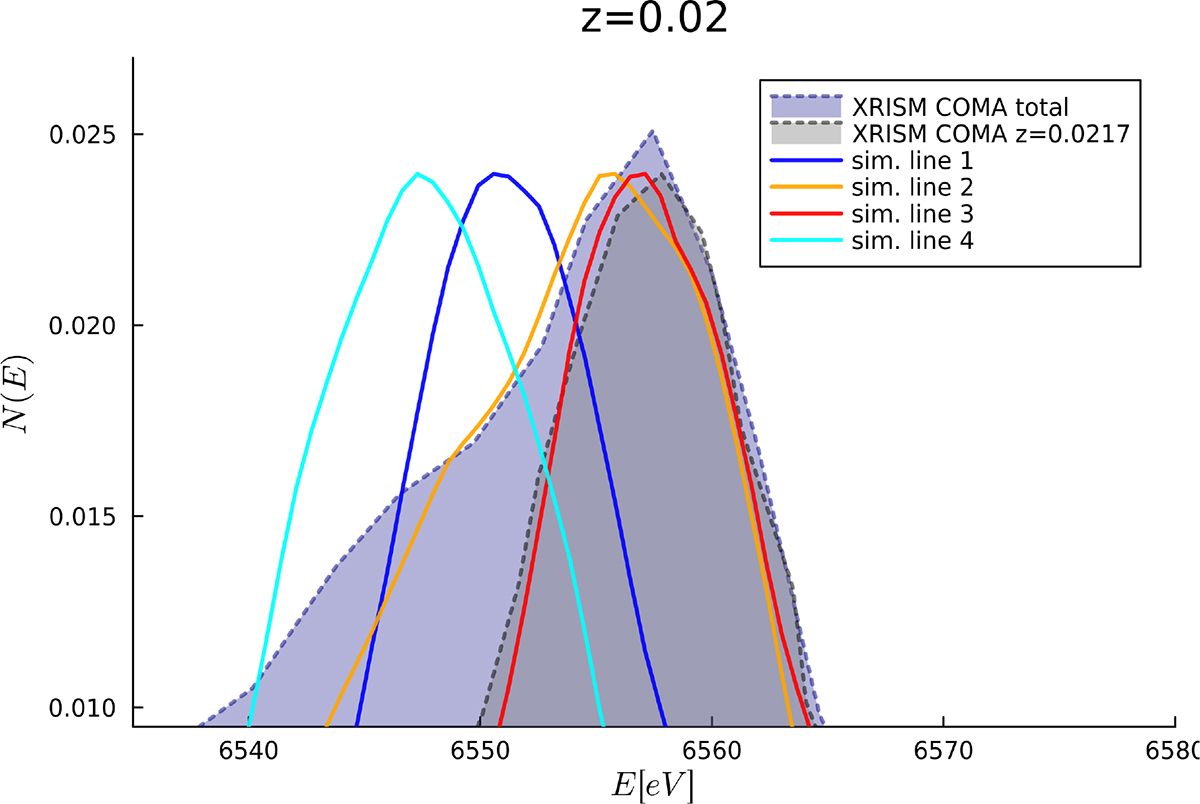
Fig. 3.
Download original image
Simulated line profiles for the four FOVs indicated in Fig. 1 (colour lines) compared with the reconstructed line models for the XRISM observation of the Coma cluster produced by Xrism Collaboration (2025b), given by the two shaded areas.
Current usage metrics show cumulative count of Article Views (full-text article views including HTML views, PDF and ePub downloads, according to the available data) and Abstracts Views on Vision4Press platform.
Data correspond to usage on the plateform after 2015. The current usage metrics is available 48-96 hours after online publication and is updated daily on week days.
Initial download of the metrics may take a while.