Fig. 4.
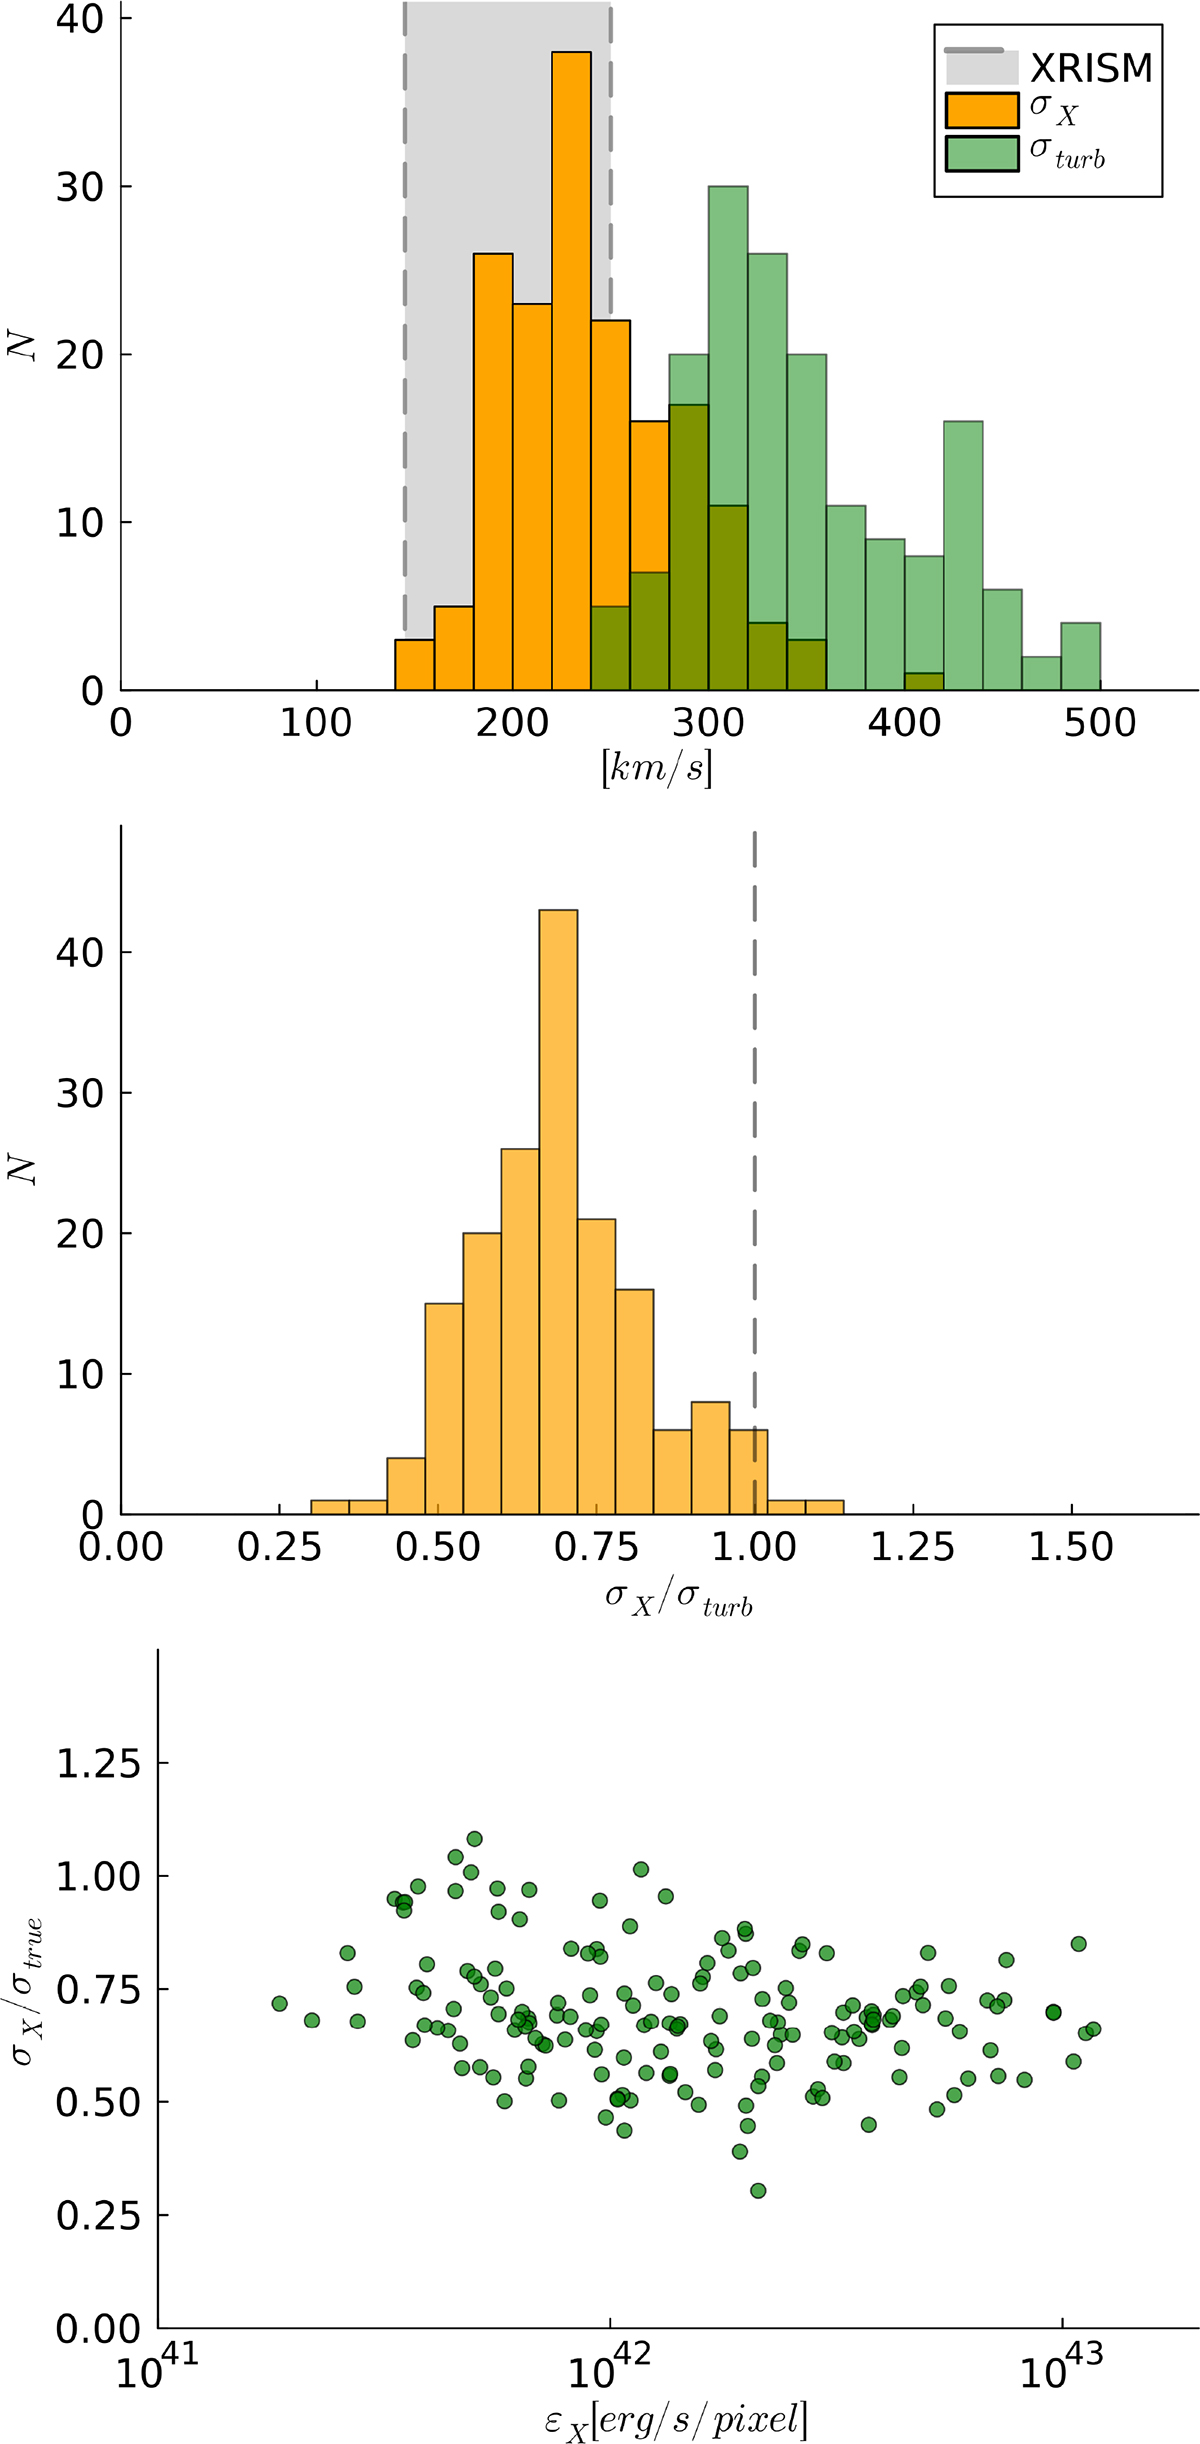
Download original image
Top panel: Histograms of X-ray weighted velocity dispersion along the LOS and of volume weighted filtered turbulent velocity dispersion (after the application of our small-scale filtering with a Λ = 300 kpc scale) for 90 × 90 kpc2 pixel maps. The additional vertical lines give the values inferred for the central FOVs observed by XRISM in the central region of Coma. Central panel: Histograms for the ratio between the two estimates of the velocity dispersion above. Bottom panel: Ratio between the X-ray weighted velocity dispersion the filtered turbulent velocity dispersion within the Λ = 300 kpc scale, as a function of the X-ray emission of cells.
Current usage metrics show cumulative count of Article Views (full-text article views including HTML views, PDF and ePub downloads, according to the available data) and Abstracts Views on Vision4Press platform.
Data correspond to usage on the plateform after 2015. The current usage metrics is available 48-96 hours after online publication and is updated daily on week days.
Initial download of the metrics may take a while.