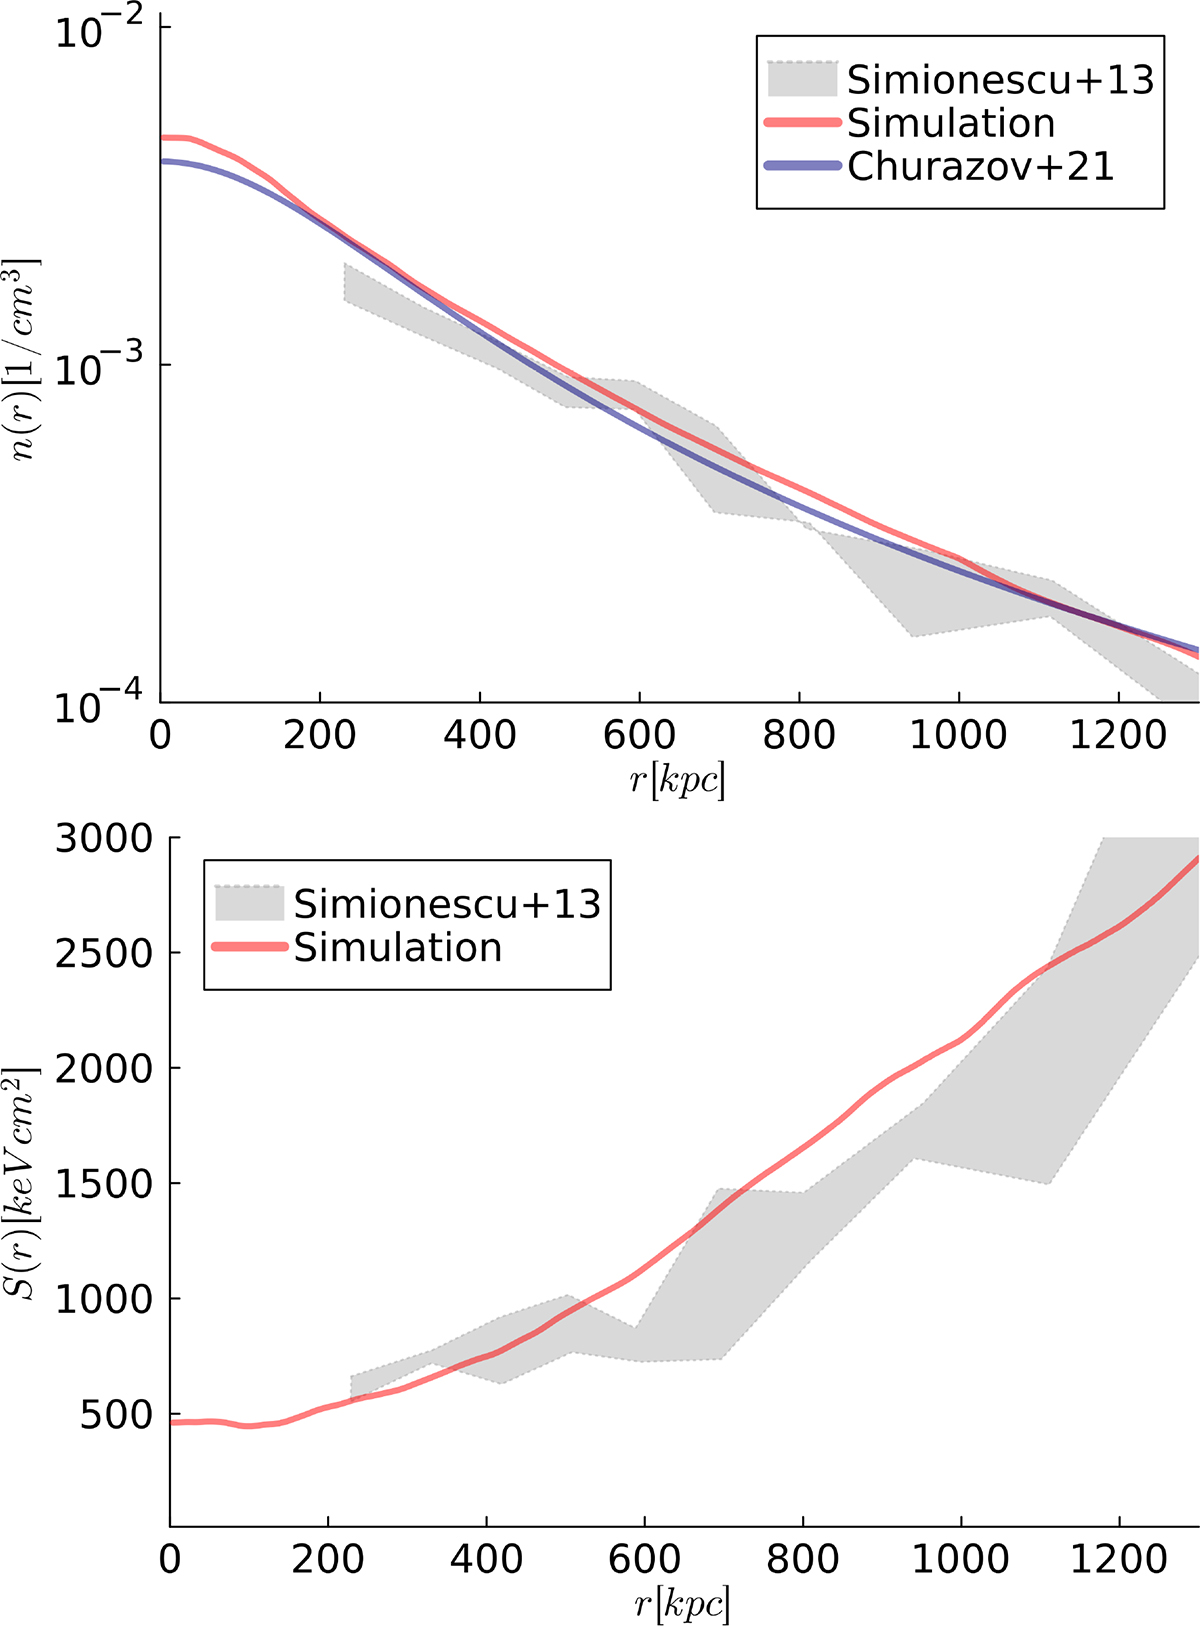
Fig. A.1.
Download original image
Average radial density (top) and gas entropy (bottom) profile for our simulated cluster at z = 0.02, compared with recent observational constraints for the real Coma cluster derived by Simionescu et al. (2013) using SUZAKU (the grey areas contain the two measurements taken within two narrow sectors in the outskirts of Coma), and by Churazov et al. (2021) using eROSITA.
Current usage metrics show cumulative count of Article Views (full-text article views including HTML views, PDF and ePub downloads, according to the available data) and Abstracts Views on Vision4Press platform.
Data correspond to usage on the plateform after 2015. The current usage metrics is available 48-96 hours after online publication and is updated daily on week days.
Initial download of the metrics may take a while.