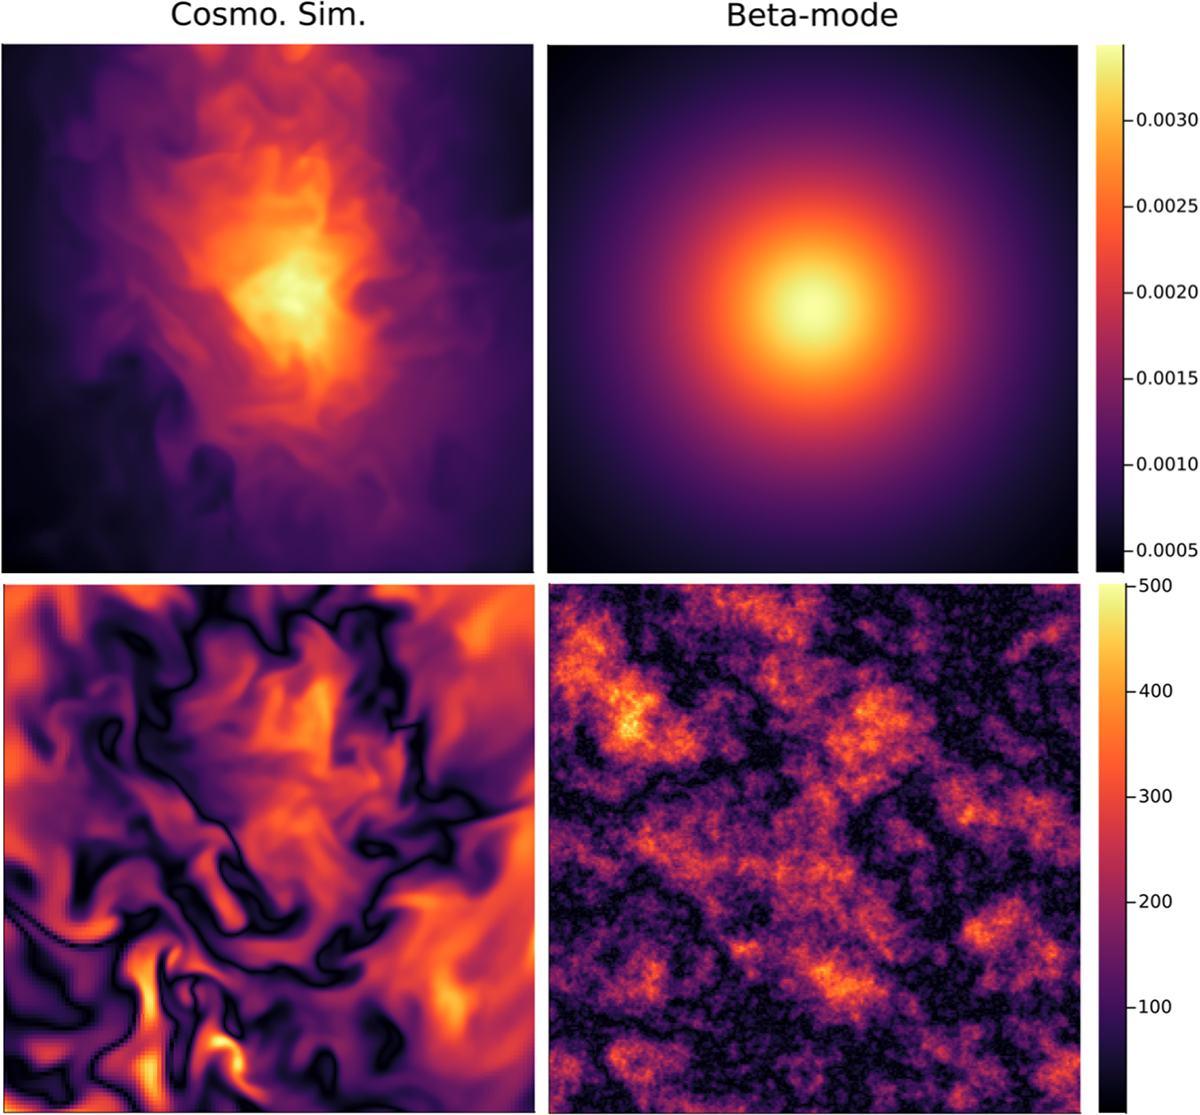
Fig. B.1.
Download original image
Top panels: Central slice showing the distribution of gas density (in units of [part/cm3]) for the clusters simulation analysed in the main article, and for a β-model of the Coma cluster instead. Lower panels: Distribution of the amplitude of the gas velocity field (in units of [km/s] for the same cosmological simulation (left) or for a 3-dimensional velocity field generated in Fourier space so that it follows the Kolmogorov spectrum for homogenous and stationary turbulence. Each panel has a side 1.6 Mpc.
Current usage metrics show cumulative count of Article Views (full-text article views including HTML views, PDF and ePub downloads, according to the available data) and Abstracts Views on Vision4Press platform.
Data correspond to usage on the plateform after 2015. The current usage metrics is available 48-96 hours after online publication and is updated daily on week days.
Initial download of the metrics may take a while.