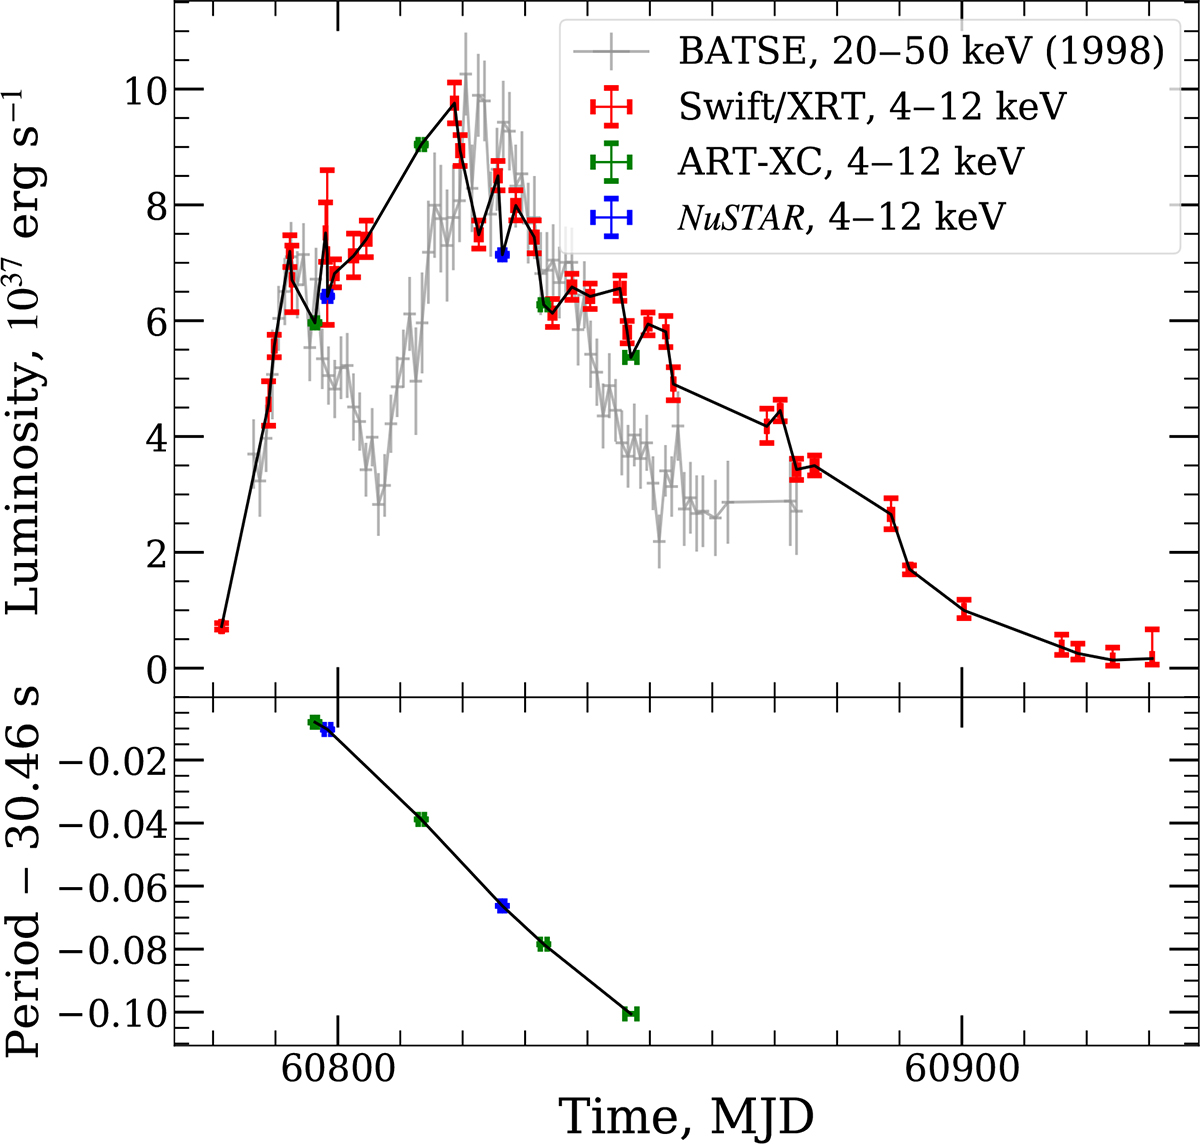
Fig. 1.
Download original image
Evolution of SXP31.0 during the 2025 outburst based on Swift/XRT, NuSTAR, and SRG/ART-XC observations. The light curve in the 4–12 keV energy range is shown at the top panel. The gray points show the CGRO/BATSE 20–50 keV pulsed luminosity from the 1998 outburst, overplotted for comparison. Along the time axis it was placed arbitrarily, and the luminosity was scaled by a factor of 0.45. The spin period (see Table 2) is shown at the bottom panel.
Current usage metrics show cumulative count of Article Views (full-text article views including HTML views, PDF and ePub downloads, according to the available data) and Abstracts Views on Vision4Press platform.
Data correspond to usage on the plateform after 2015. The current usage metrics is available 48-96 hours after online publication and is updated daily on week days.
Initial download of the metrics may take a while.