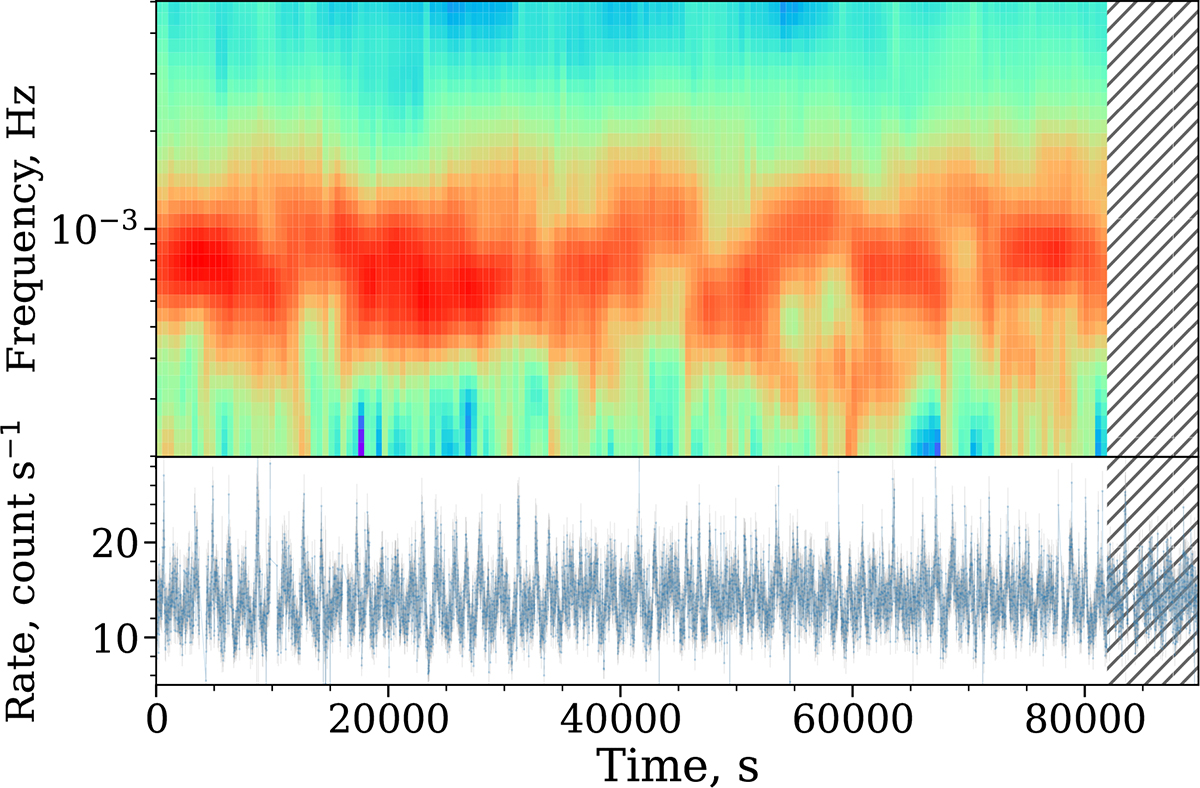
Fig. 2.
Download original image
Smoothed dynamic power spectrum (top) and light curve (bottom) of NuObs1 in the 3–79 keV energy band. The dynamic power spectrum is computed using a sliding window of 8192 s with a step of 512 s. The hatched region indicates the part of the time range where the sliding window cannot be applied without extending beyond the data boundaries. The light curve is binned with a 10 s time resolution.
Current usage metrics show cumulative count of Article Views (full-text article views including HTML views, PDF and ePub downloads, according to the available data) and Abstracts Views on Vision4Press platform.
Data correspond to usage on the plateform after 2015. The current usage metrics is available 48-96 hours after online publication and is updated daily on week days.
Initial download of the metrics may take a while.