Fig. 3.
Download original image
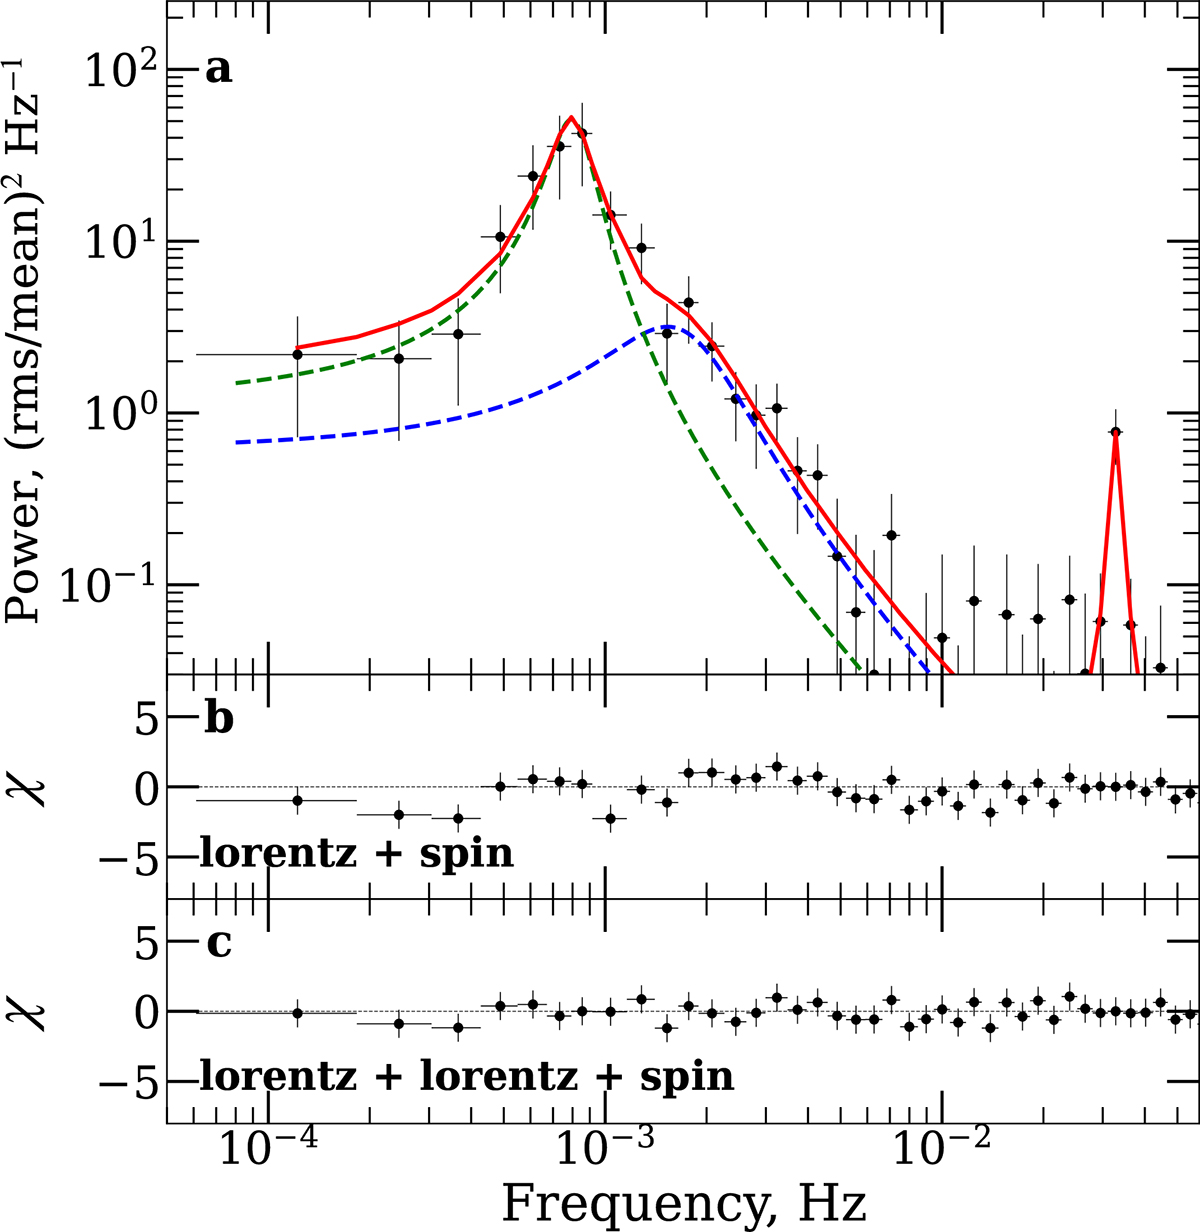
Rms-normalized PDS of SXP31.0 during the QPO-active interval for NuObs1 (3–79 keV) computed from the first 32.8 ks of the observation where the QPO is most prominent. The best-fit model is shown in red, with the green dashed line for the QPO component and the blue dashed line for the shoulder component. Panel (b) shows residuals to the model with only the QPO and spin frequency, while panel (c) shows residuals after adding the shoulder component.
Current usage metrics show cumulative count of Article Views (full-text article views including HTML views, PDF and ePub downloads, according to the available data) and Abstracts Views on Vision4Press platform.
Data correspond to usage on the plateform after 2015. The current usage metrics is available 48-96 hours after online publication and is updated daily on week days.
Initial download of the metrics may take a while.