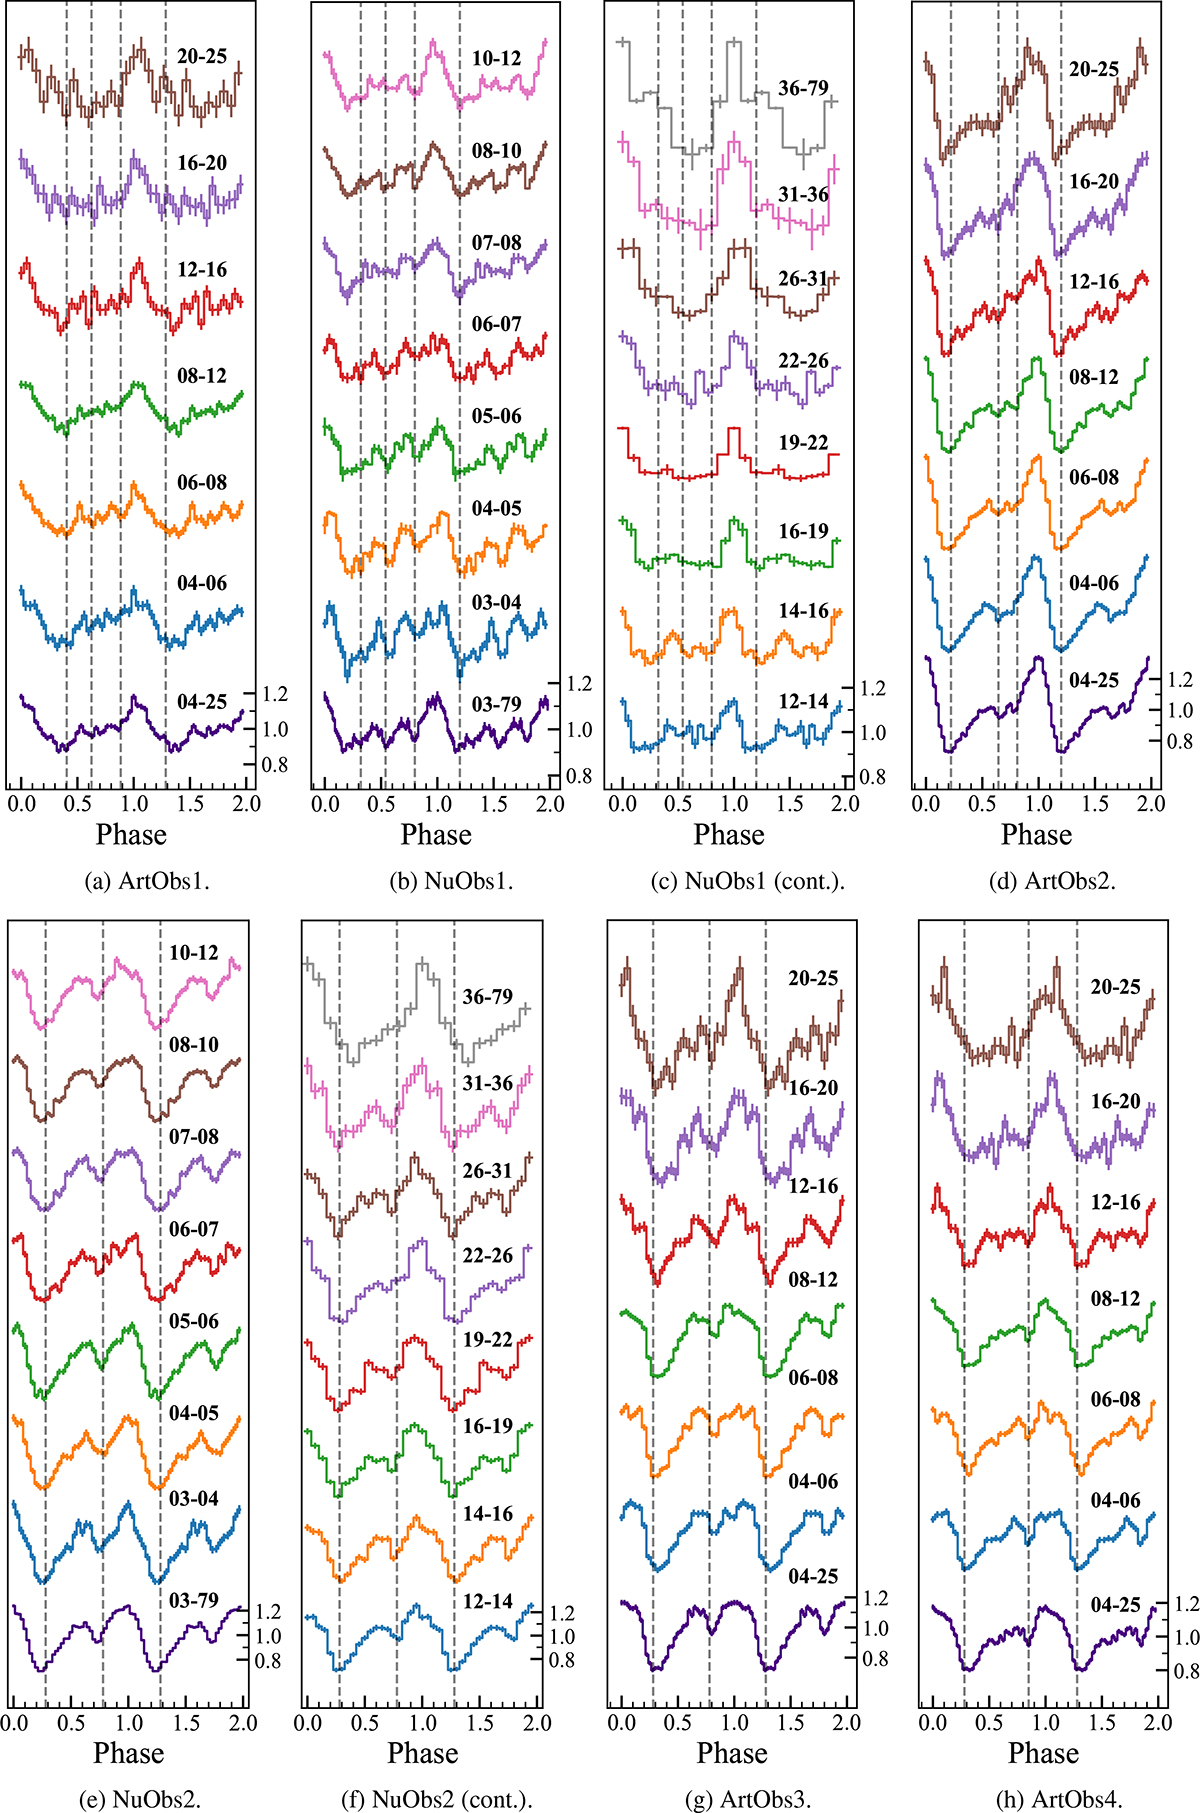
Fig. 5.
Download original image
Energy-resolved pulse profiles of SXP31.0. Gray dashed vertical lines mark the boundaries of the pulse peaks. The phase corresponding to the maximum of the profile is set to zero. Two full periods are shown per profile, each vertically offset for clarity. The flux in each energy band is normalized to its mean value. Energy ranges (in keV) are labeled next to each profile.
Current usage metrics show cumulative count of Article Views (full-text article views including HTML views, PDF and ePub downloads, according to the available data) and Abstracts Views on Vision4Press platform.
Data correspond to usage on the plateform after 2015. The current usage metrics is available 48-96 hours after online publication and is updated daily on week days.
Initial download of the metrics may take a while.