Open Access
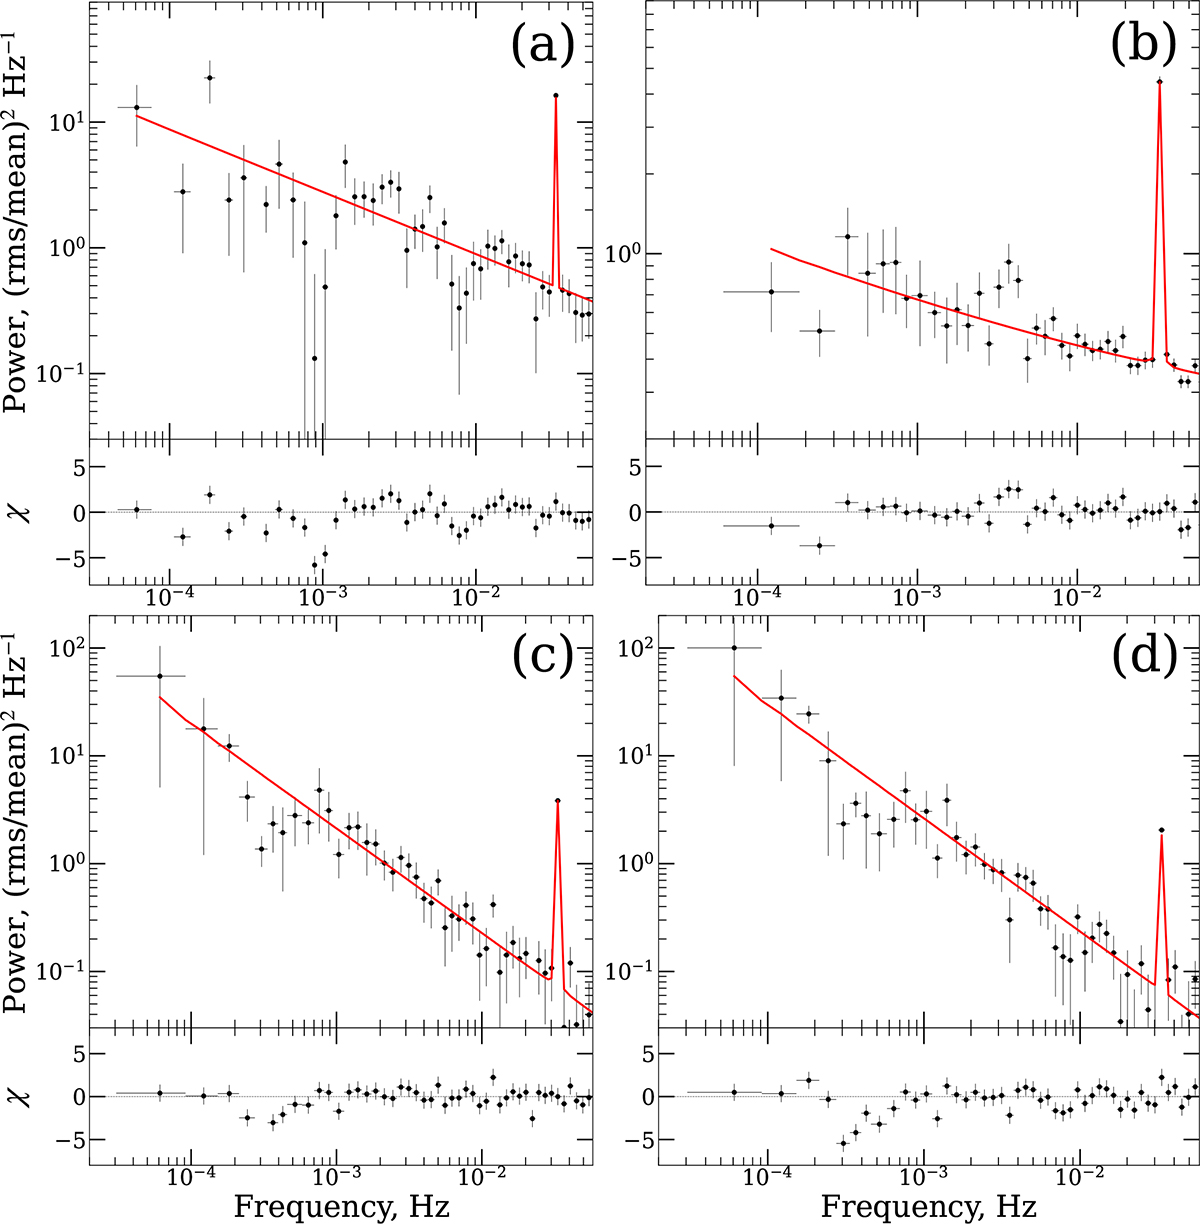
Fig. 7.
Download original image
Rms-normalized PDS of SXP31.0 obtained after the initial detection. Upper subpanels show the data (black crosses) and the best-fit model (red line). The lower subpanels show the residuals. Panels (a), (b), (c), and (d) correspond to ArtObs2, NuObs2, ArtObs3, and ArtObs4 datasets, respectively. See text for details.
Current usage metrics show cumulative count of Article Views (full-text article views including HTML views, PDF and ePub downloads, according to the available data) and Abstracts Views on Vision4Press platform.
Data correspond to usage on the plateform after 2015. The current usage metrics is available 48-96 hours after online publication and is updated daily on week days.
Initial download of the metrics may take a while.