Fig. 8.
Download original image
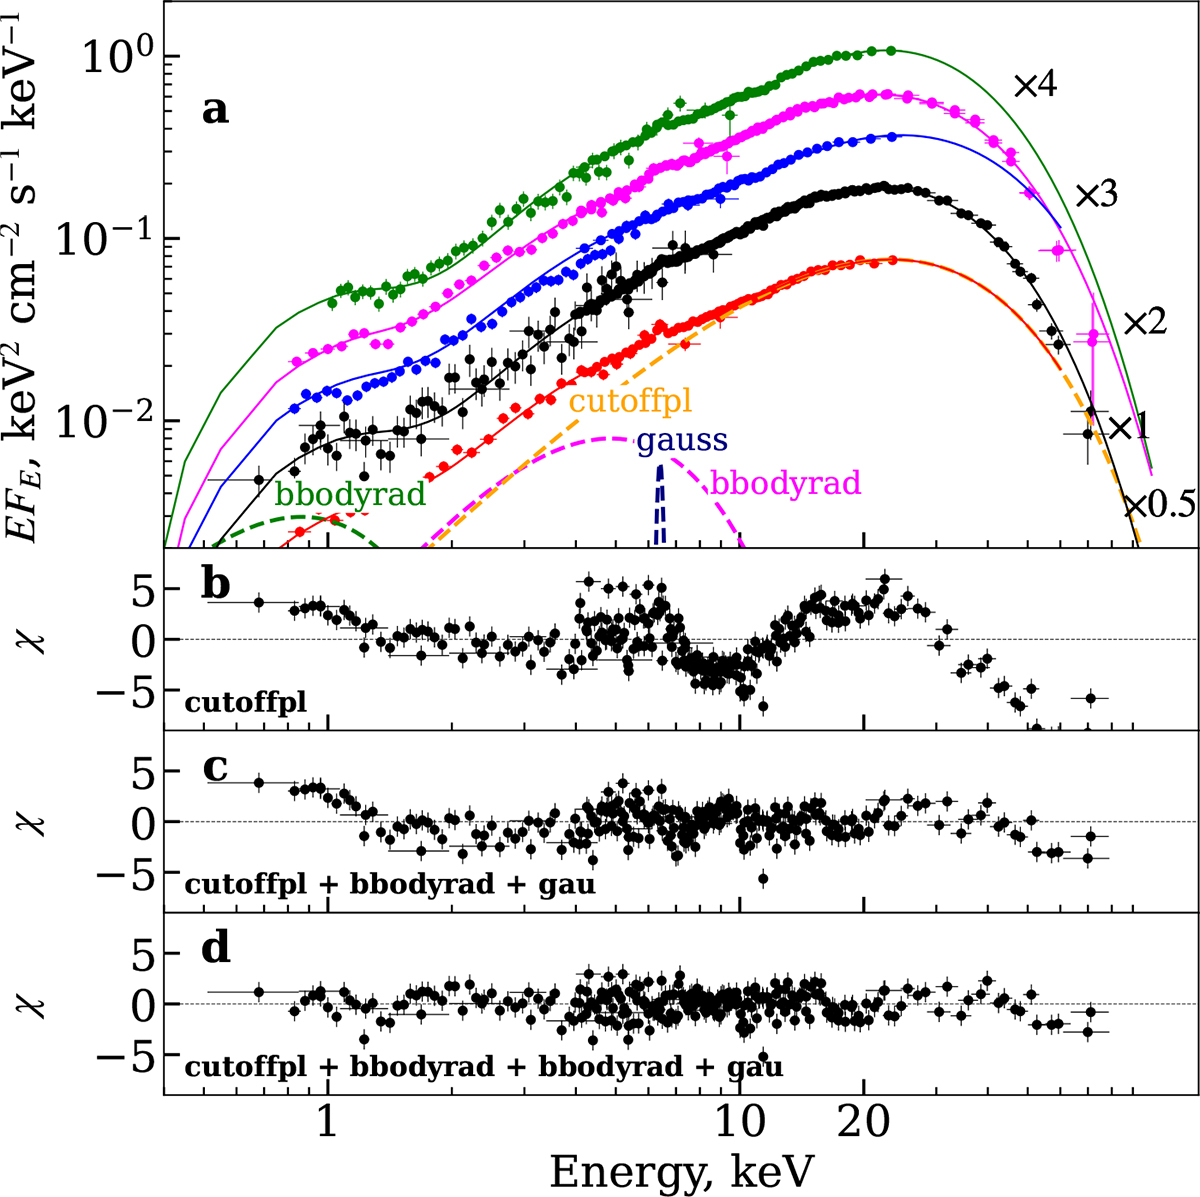
Unfolded energy spectra of SXP31.0. The spectra were spaced along the y-axis for visual convenience with the factors shown. The black, green, magenta, blue, and red points correspond to the epoch 1–5 data and their respective model approximations. The dashed lines represent the individual model components (cutoffpl, bbodyrad, gauss, and a second bbodyrad) for the epoch 5 dataset. Panels (b), (c), and (d) show the residuals of the epoch 1 dataset when fitted with the cutoffpl model alone, with an additional bbodyrad component, and with two bbodyrad components, respectively.
Current usage metrics show cumulative count of Article Views (full-text article views including HTML views, PDF and ePub downloads, according to the available data) and Abstracts Views on Vision4Press platform.
Data correspond to usage on the plateform after 2015. The current usage metrics is available 48-96 hours after online publication and is updated daily on week days.
Initial download of the metrics may take a while.