Fig. 2.
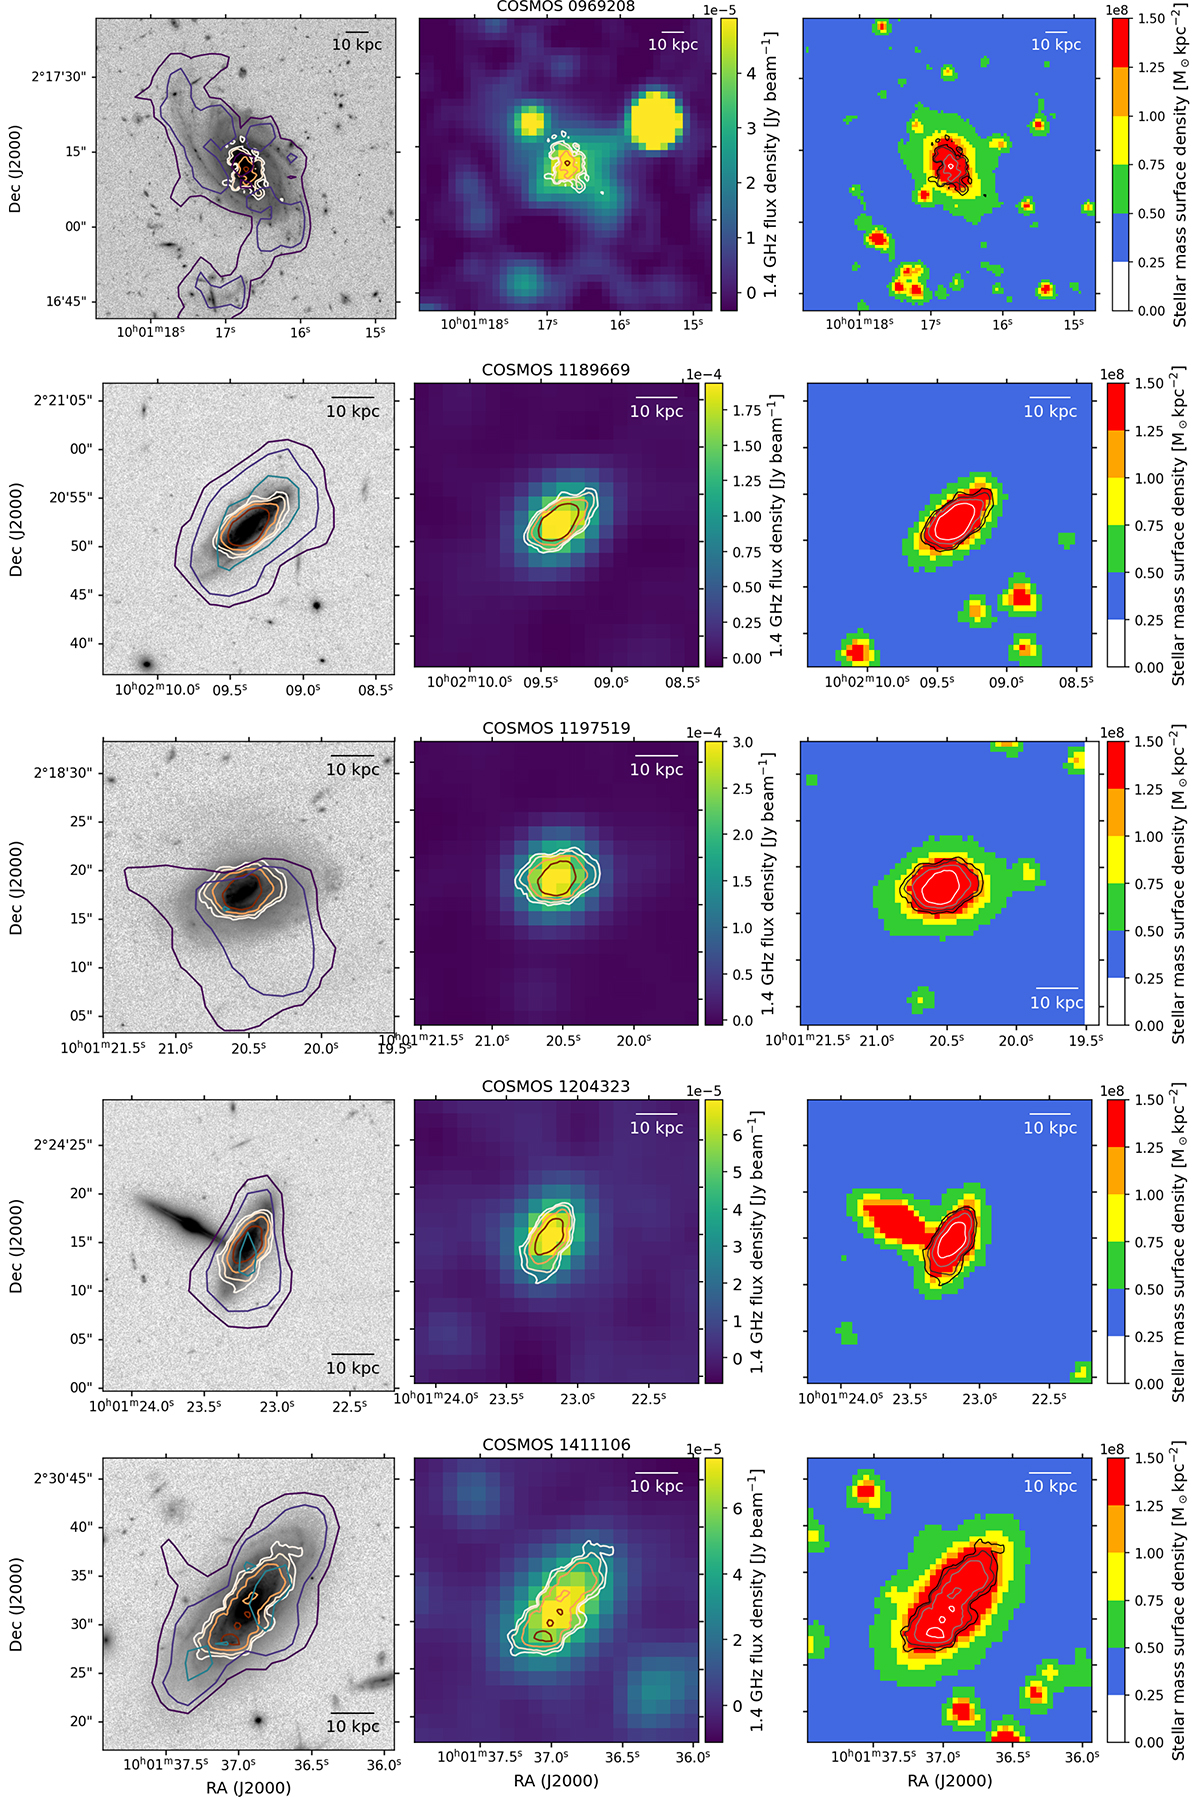
Download original image
Left: HST/ACS F814W images overlaid with H I contours (purple to teal) as in Fig. 1 and CO (1–0) contours (white to red). CO contours correspond to H2 column densities 2n × [3.6, 2.6, 2.3, 2.3, 3.9]×1020 cm−2 (n = 0, 1, 2, …) Center: CHILES Con Pol 1.4 GHz continuum images, overlaid with CO contours (white to dark red). Right: Spitzer 3.6 μm images, converted to bins of stellar mass surface density overlaid with CO contours (black to white). Galaxies are presented in the same order top-to-bottom that they are left-to-right in Figure 1.
Current usage metrics show cumulative count of Article Views (full-text article views including HTML views, PDF and ePub downloads, according to the available data) and Abstracts Views on Vision4Press platform.
Data correspond to usage on the plateform after 2015. The current usage metrics is available 48-96 hours after online publication and is updated daily on week days.
Initial download of the metrics may take a while.