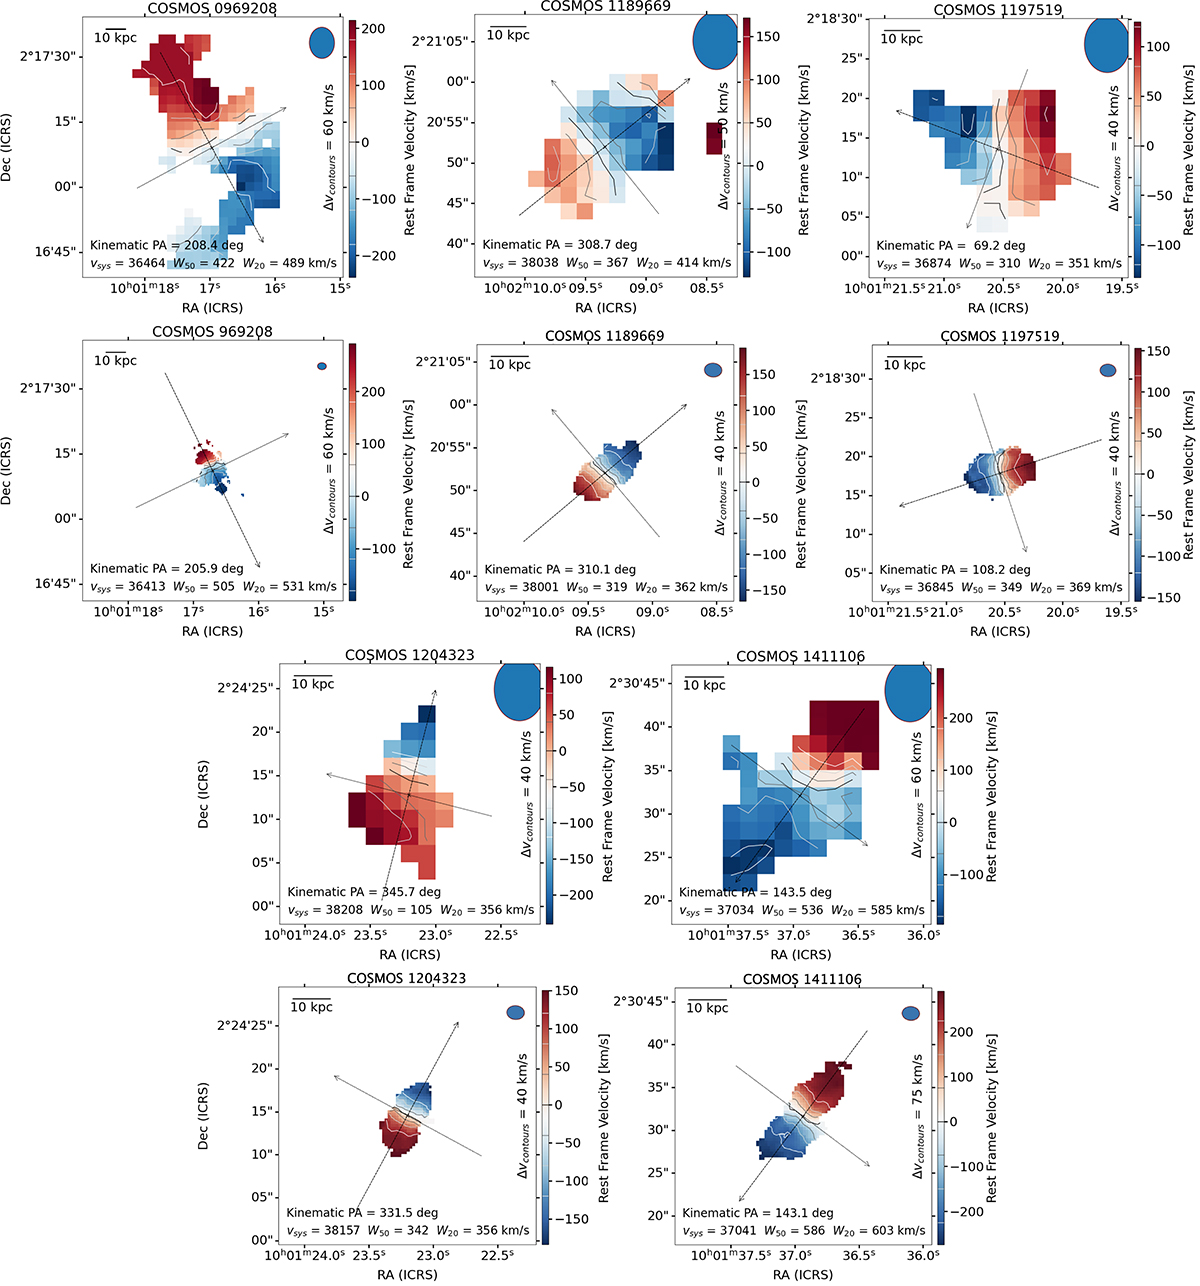
Fig. 3.
Download original image
H I (top) and CO (bottom) intensity weighted velocity (moment 1) maps for the five CO detections. The kinematic major axis is indicated by the dashed line. The position angle, systemic velocity, profile width at 20% and 50% of the peak (W20 and W50), as calculated by SoFiA-2, are written inset at the bottom of the figures. The H I and CO for each galaxy are plotted on the same scale.
Current usage metrics show cumulative count of Article Views (full-text article views including HTML views, PDF and ePub downloads, according to the available data) and Abstracts Views on Vision4Press platform.
Data correspond to usage on the plateform after 2015. The current usage metrics is available 48-96 hours after online publication and is updated daily on week days.
Initial download of the metrics may take a while.