Open Access
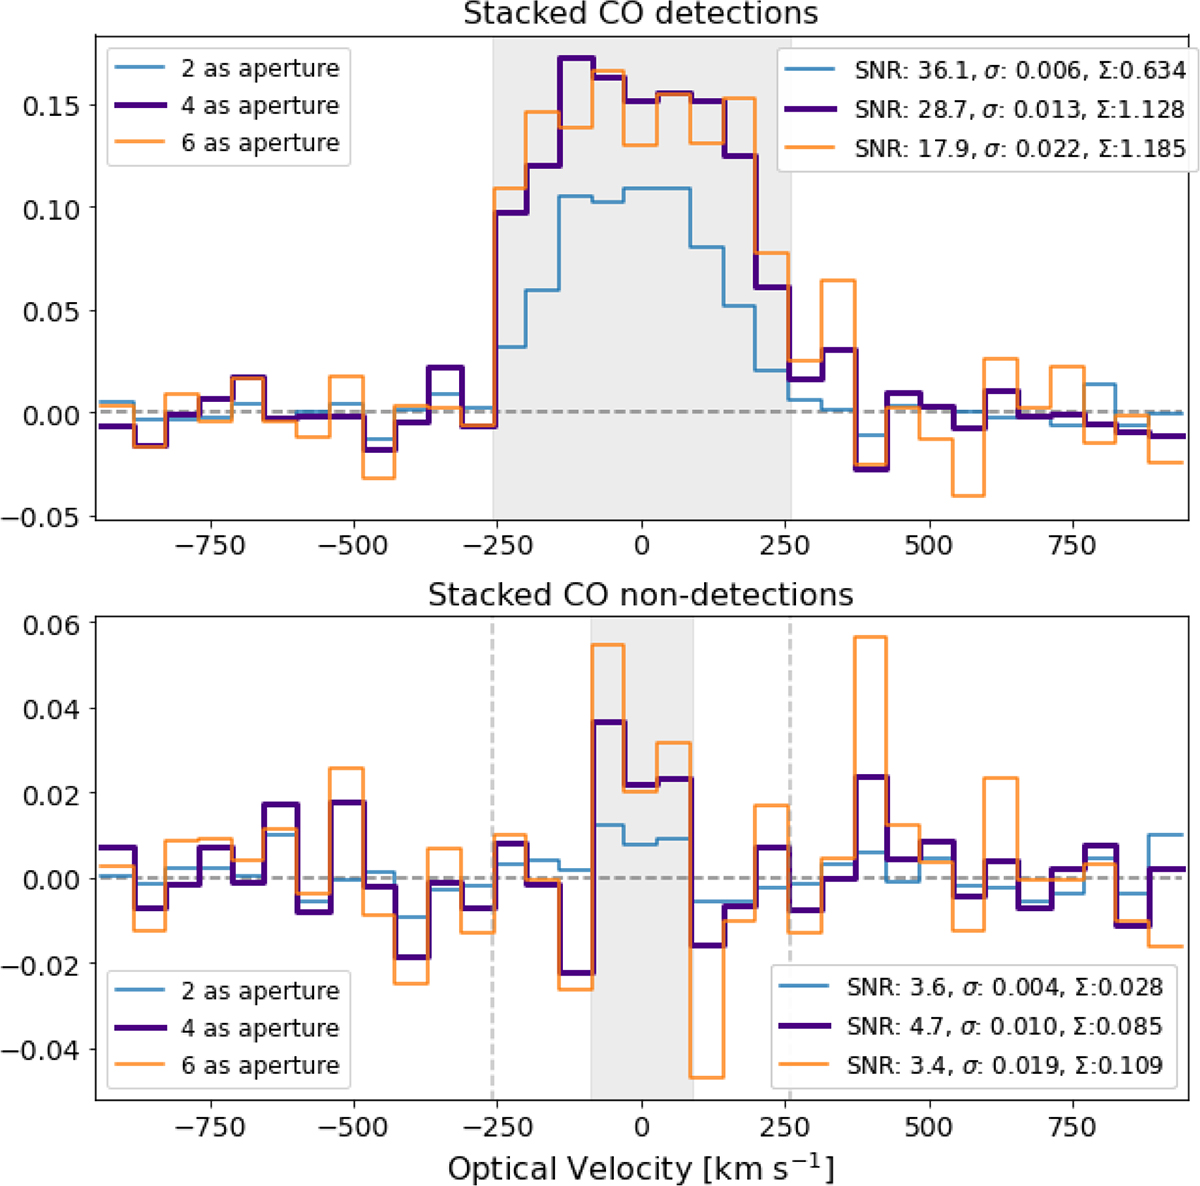
Fig. 5.
Download original image
Spectra extracted from the [2, 4, 6] arcsec apertures for the CO detections (top) and over the 4 arcsec aperture for the CO non-detections (bottom). Light gray regions indicate channels over which emission is detected and the cubes are collapsed make the CO maps in Figure 4. See text for further details.
Current usage metrics show cumulative count of Article Views (full-text article views including HTML views, PDF and ePub downloads, according to the available data) and Abstracts Views on Vision4Press platform.
Data correspond to usage on the plateform after 2015. The current usage metrics is available 48-96 hours after online publication and is updated daily on week days.
Initial download of the metrics may take a while.