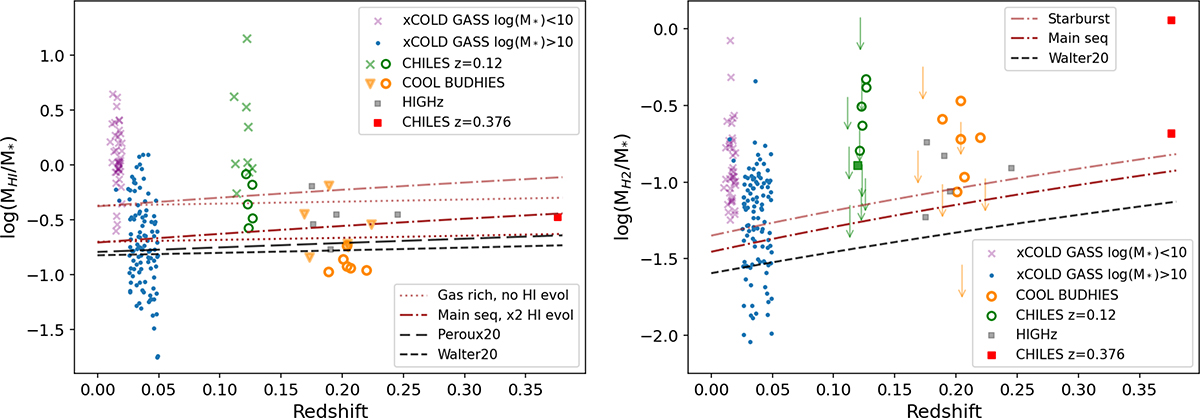
Fig. 6.
Download original image
Left: H I mass divided by stellar mass as a function of redshift for CHILES, xCOLD GASS, COOL BUDHIES, and HIGHz. The dark brown lines are the typical gas ratio for a gas-rich galaxy (log(M*/M⊙) = 10.3 from a stellar mass-selected sample of Catinella et al. (2018). The light brown lines are the gas ratio for a gas-rich galaxy of the same mass based on Maddox et al. (2015). Right: H2 mass divided by stellar mass for the same samples. Here the dark brown line is the molecular gas-to-stellar ratio for a log(M*/M⊙) = 10.3 main sequence galaxy, and the light brown line is for a starburst galaxy, both based on the empirical evolutionary models of Scoville et al. (2023). The dotted brown lines are for no H I evolution; the dot-dashed brown lines are for a “fast” factor of two evolution between z = 0 to z = 1. See the text for details. The black short-dashed lines indicate the functional fits to the evolution of the cosmic density from Walter et al. (2020). In the left plot, the black long-dashed lines are the fit to the same H I data by Péroux & Howk (2020). The rest of the symbols are the same for both plots: purple ‘x’s and blue dots are detections in the xCOLD GASS sample below and above log(M*/M⊙) = 10, respectively. Green symbols are CHILES z = 0.12 galaxies (this work); orange symbols are COOL BUDHIES galaxies. In both CHILES and COOL BUDHIES the open circles are galaxies with both CO and H I detections, the downward arrows and ‘x’/downward triangles are galaxies with CO upper limits. In CHILES, the green ‘x’s/downward arrows have the same mass range as the xCOLD GASS ‘x’s. The green square is the stacked CO non-detections. Gray squares are HIGHz galaxies. Red symbols are the CHILES z = 0.376 detection corresponding to conversion factors for interacting galaxies (αCO = 0.8, bottom) and the Galactic value (αCO = 4.3, top) (Fernández et al. 2016). The uncertainties for the CHILES galaxies in the left panel are ±0.15 − 0.25 dex, and ±0.1 − 0.15 dex in the left panel. See text for further details.
Current usage metrics show cumulative count of Article Views (full-text article views including HTML views, PDF and ePub downloads, according to the available data) and Abstracts Views on Vision4Press platform.
Data correspond to usage on the plateform after 2015. The current usage metrics is available 48-96 hours after online publication and is updated daily on week days.
Initial download of the metrics may take a while.