Fig. 7.
Download original image
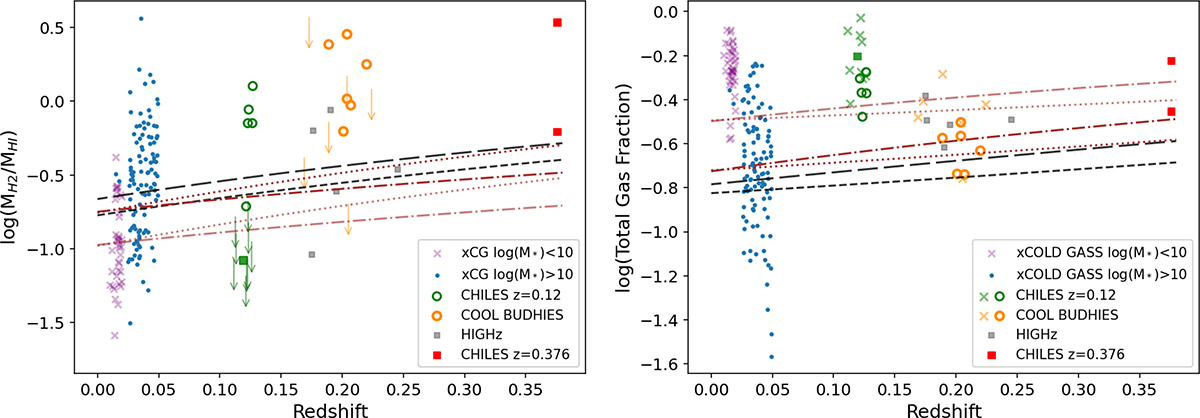
Comparison of molecular and atomic gas samples. Left: the ratio of molecular versus atomic gas as a function of redshift. Right: the total gas fraction ((MHI + MH2)/(M* + MHI + MH2)) as a function of redshift. The symbols are the same as Figure 6. In both plots, the lower red symbol corresponds to the CHILES z = 0.376 detection assuming αCO = 0.8 and the higher red symbol corresponds to the same galaxy assuming αCO = 4.3. We have omitted the second legend for clarity. To plot the dark brown lines, we combine the “typical” H I model from 6a with the “main sequence” model for molecular gas from 6b. To plot the light brown lines, we combine the H I “gas-rich” model from Fig. 6a with the molecular gas “starburst” model from 6b. See the text for more details.
Current usage metrics show cumulative count of Article Views (full-text article views including HTML views, PDF and ePub downloads, according to the available data) and Abstracts Views on Vision4Press platform.
Data correspond to usage on the plateform after 2015. The current usage metrics is available 48-96 hours after online publication and is updated daily on week days.
Initial download of the metrics may take a while.