Fig. A.1.
Download original image
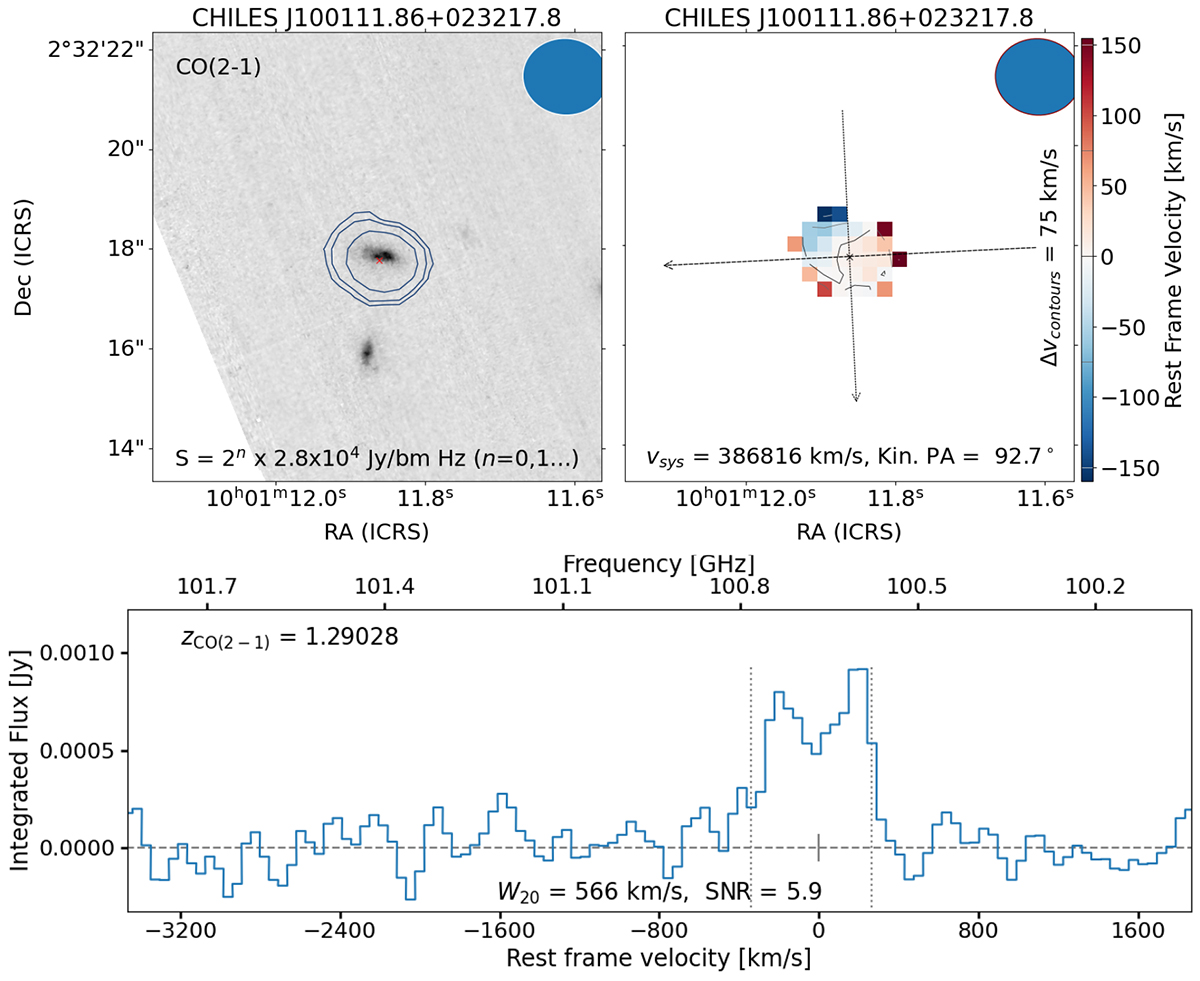
Properties of the serendipitous detection. Top left: JWST f150w image with CO(2-1) contours. Top right: Intensity weighted velocity map showing the kinematic major and minor axes. In both cases, the ALMA beam is shown in the top right. Bottom: Aperture spectrum over the CO detection. The gray lines denote the spectral extent of the source mask.
Current usage metrics show cumulative count of Article Views (full-text article views including HTML views, PDF and ePub downloads, according to the available data) and Abstracts Views on Vision4Press platform.
Data correspond to usage on the plateform after 2015. The current usage metrics is available 48-96 hours after online publication and is updated daily on week days.
Initial download of the metrics may take a while.