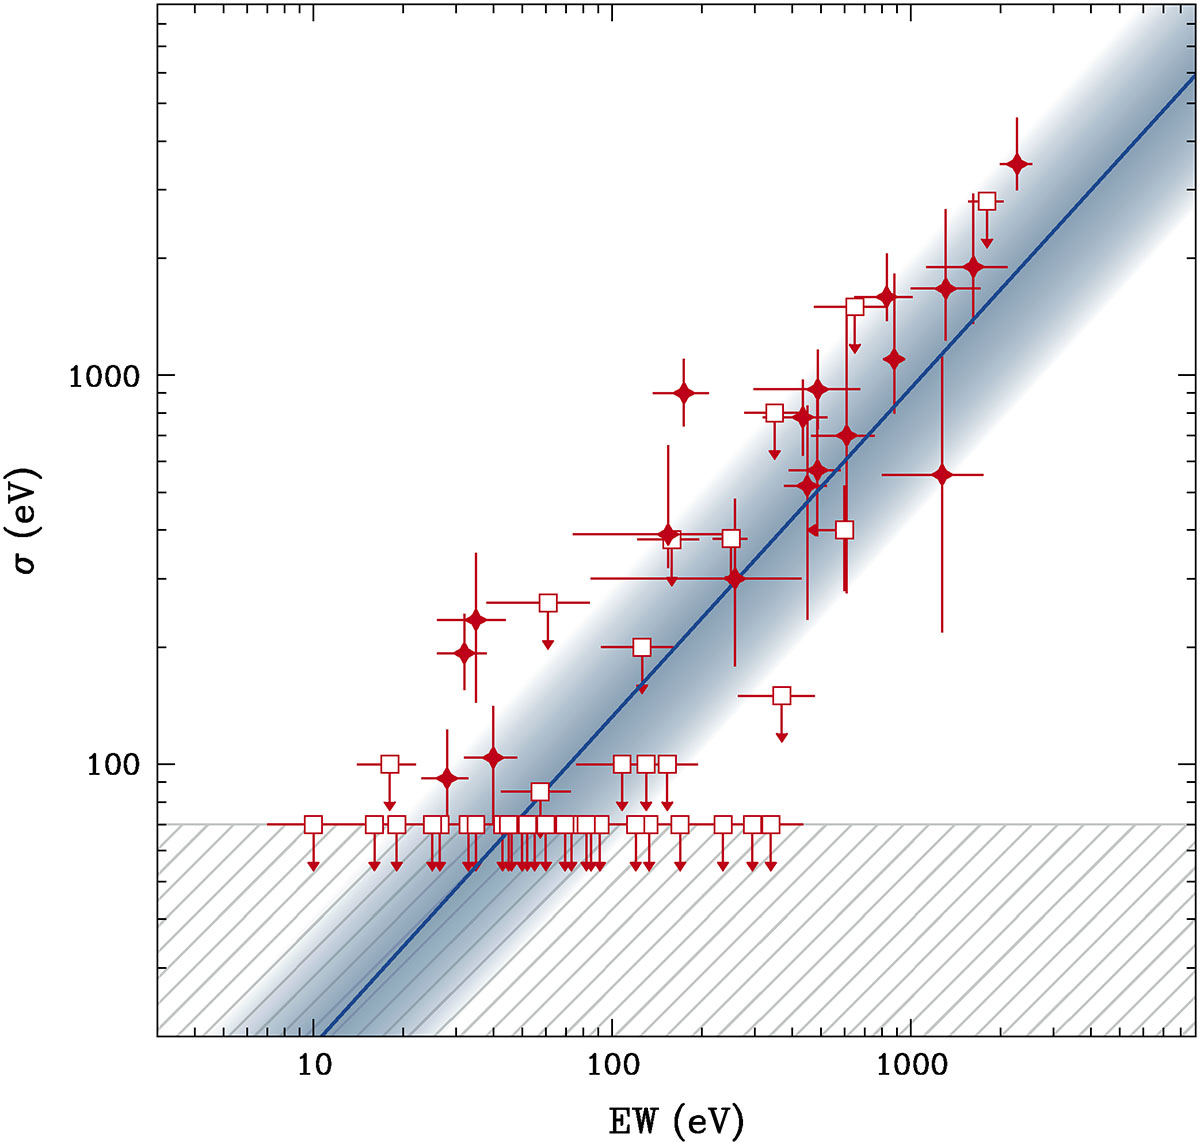
Fig. 2.
Download original image
Distribution of UFOs for each AGN in our sample in the σ–EW plane. Solid blue line and shaded areas describe the best-fit relation and its 1σ spread, respectively. Hatched region marks the average threshold on the line width for the current instrumental CCD resolution in the Fe K band. White squares are the UFOs with upper limits in σ or EW.
Current usage metrics show cumulative count of Article Views (full-text article views including HTML views, PDF and ePub downloads, according to the available data) and Abstracts Views on Vision4Press platform.
Data correspond to usage on the plateform after 2015. The current usage metrics is available 48-96 hours after online publication and is updated daily on week days.
Initial download of the metrics may take a while.