Fig. 6.
Download original image
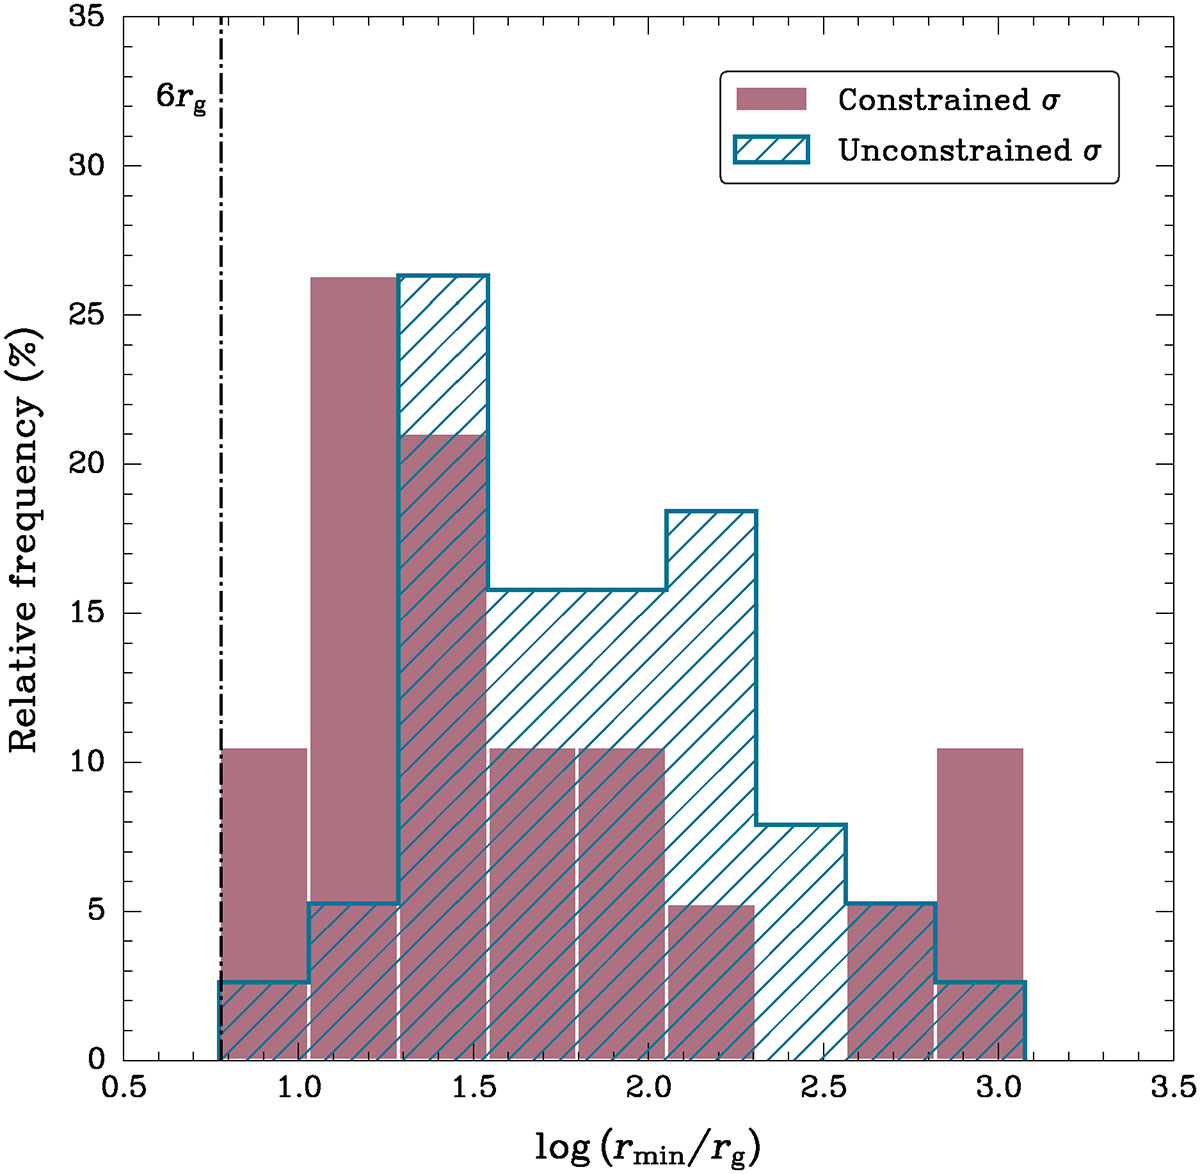
Relative frequency histogram showing the distribution of the lower limits rmin for the launching radius in units of rg for the two subsamples with constrained (in red) and unconstrained line width (in blue), respectively. Dash-dotted black line indicates the location of the ISCO around a non-rotating Schwartzschild black hole.
Current usage metrics show cumulative count of Article Views (full-text article views including HTML views, PDF and ePub downloads, according to the available data) and Abstracts Views on Vision4Press platform.
Data correspond to usage on the plateform after 2015. The current usage metrics is available 48-96 hours after online publication and is updated daily on week days.
Initial download of the metrics may take a while.