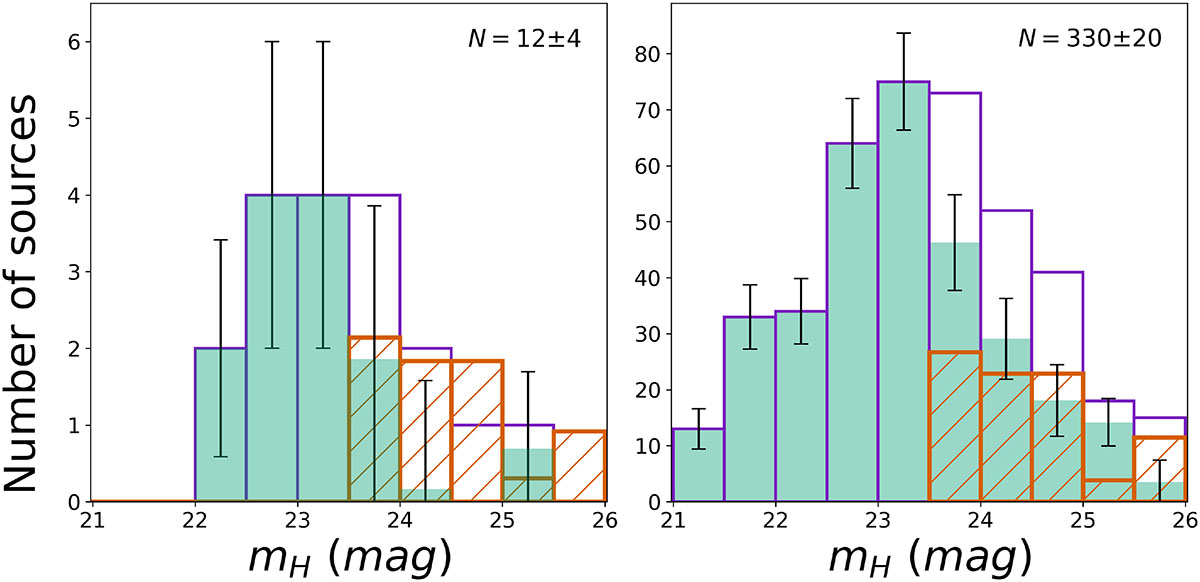
Fig. 12.
Download original image
Left panel: Combined LF of GC candidates around all UDGs (violet histogram), shown alongside the assumed background distribution (orange hatched histogram) and the background-subtracted LF (teal histogram). Right panel: LF distributions derived from the full master catalog. The total number of GCs after background subtraction is indicated in each panel.
Current usage metrics show cumulative count of Article Views (full-text article views including HTML views, PDF and ePub downloads, according to the available data) and Abstracts Views on Vision4Press platform.
Data correspond to usage on the plateform after 2015. The current usage metrics is available 48-96 hours after online publication and is updated daily on week days.
Initial download of the metrics may take a while.