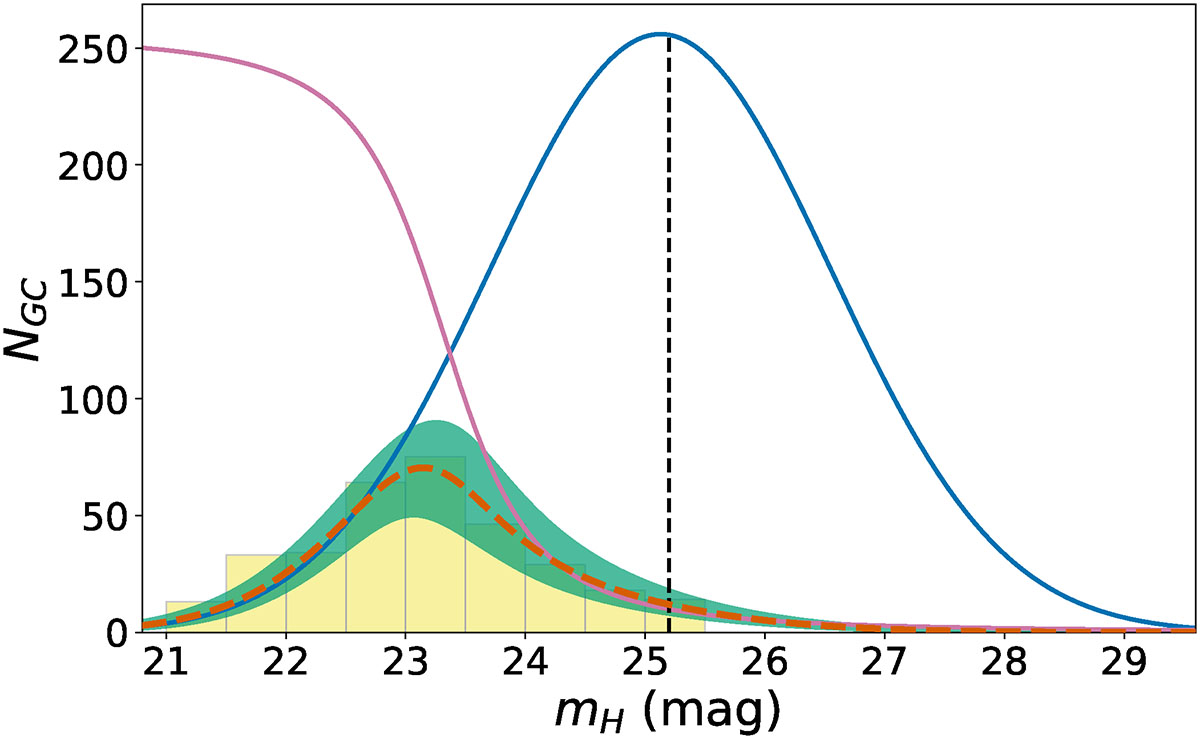
Fig. 13.
Download original image
Results of the modeling MC-based procedure. The blue solid line represents the best-fit GCLF, while the pink solid line shows the fit to the completeness function. The yellow histogram indicates the background-corrected observed GC distribution, and the orange dashed line corresponds to the best-fit model. The green-shaded region denotes the 1σ uncertainty envelope.
Current usage metrics show cumulative count of Article Views (full-text article views including HTML views, PDF and ePub downloads, according to the available data) and Abstracts Views on Vision4Press platform.
Data correspond to usage on the plateform after 2015. The current usage metrics is available 48-96 hours after online publication and is updated daily on week days.
Initial download of the metrics may take a while.