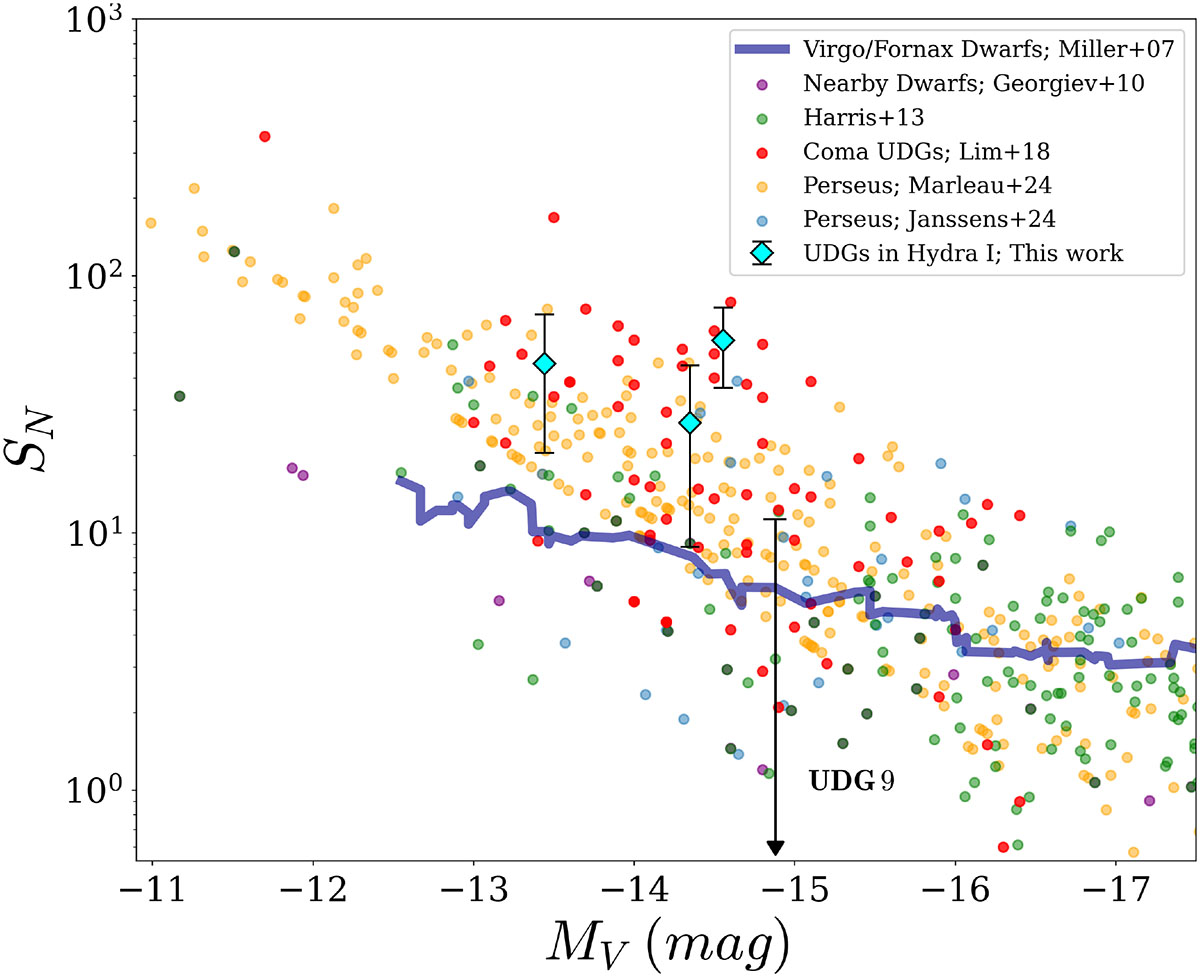
Fig. 14.
Download original image
Specific frequency versus magnitude plot comparing Hydra I UDGs SN with literature values of dwarfs and UDGs from different environments Miller & Lotz (2007), Georgiev et al. (2009), Harris et al. (2013), Lim et al. (2024), Marleau et al. (2025), Janssens et al. (2024). All literature measurements are shown as colored dots, except for the Miller & Lotz (2007) data, which is displayed as a running mean (solid blue line).
Current usage metrics show cumulative count of Article Views (full-text article views including HTML views, PDF and ePub downloads, according to the available data) and Abstracts Views on Vision4Press platform.
Data correspond to usage on the plateform after 2015. The current usage metrics is available 48-96 hours after online publication and is updated daily on week days.
Initial download of the metrics may take a while.