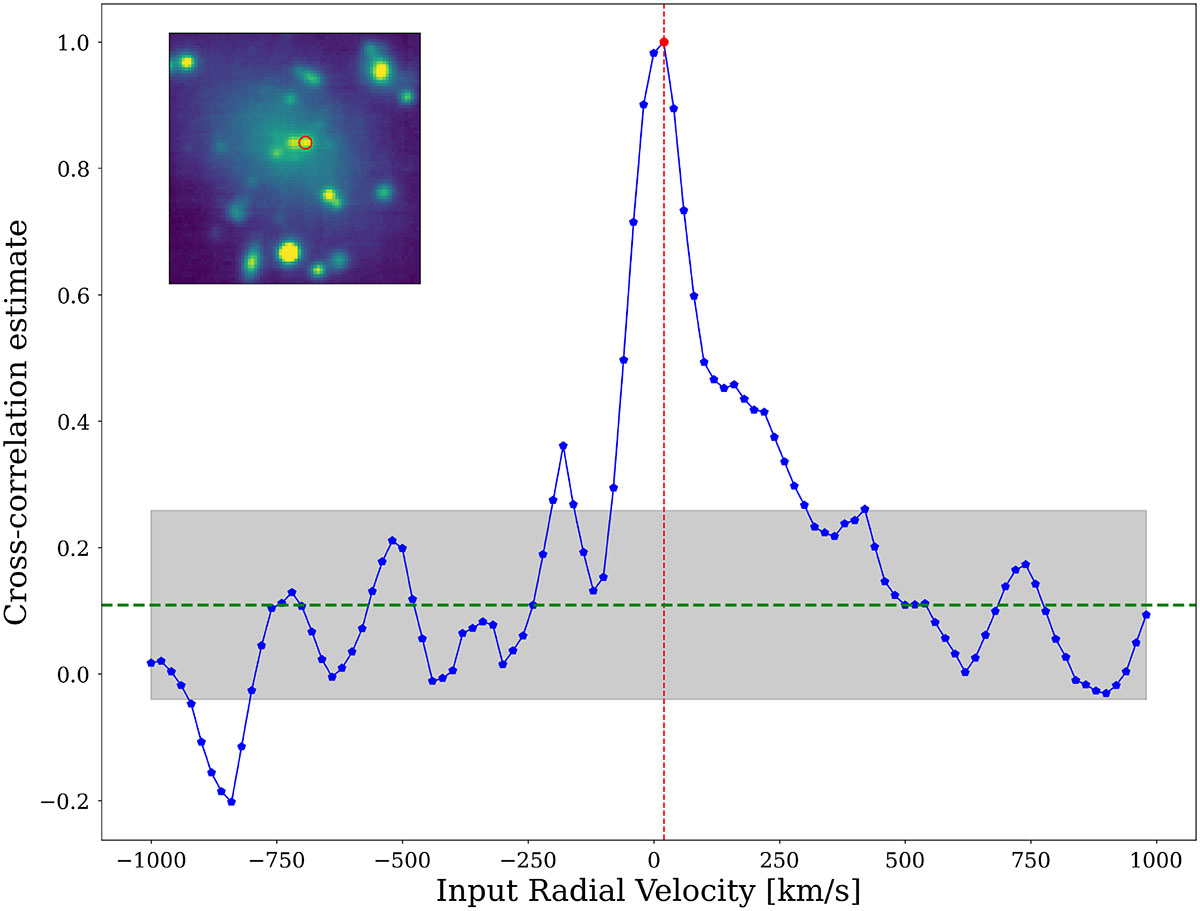
Fig. C.1.
Download original image
Cross-correlation results. The red dashed line marks the maximum of the correlation, indicating the relative shift between the galaxy spectrum and the source spectrum. The green dashed line represents the median of the cross-correlation estimates. The gray shaded region denotes the ±1rmsMAD around the median. In the upper left corner, an 80×80 pixels zoom-in of the white-light image of the central region of UDG 11 is shown, with a red circle marking the specific source that is analyzed.
Current usage metrics show cumulative count of Article Views (full-text article views including HTML views, PDF and ePub downloads, according to the available data) and Abstracts Views on Vision4Press platform.
Data correspond to usage on the plateform after 2015. The current usage metrics is available 48-96 hours after online publication and is updated daily on week days.
Initial download of the metrics may take a while.