Fig. C.3.
Download original image
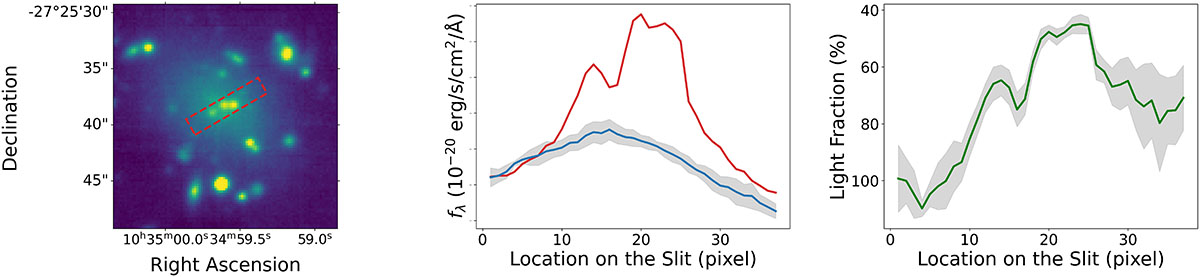
Left panel: Red dashed rectangle indicates the slit used to extract the flux profile of the sources. Additional slits were placed around the galaxy center to estimate the galaxy light contribution. Middle panel: Flux profile along the slit containing the sources (red curve) compared to the median galaxy flux profile (blue curve). The gray shaded region represents the associated uncertainties. Right panel: Estimated fraction of galaxy light for each of the three sources.
Current usage metrics show cumulative count of Article Views (full-text article views including HTML views, PDF and ePub downloads, according to the available data) and Abstracts Views on Vision4Press platform.
Data correspond to usage on the plateform after 2015. The current usage metrics is available 48-96 hours after online publication and is updated daily on week days.
Initial download of the metrics may take a while.