Fig. E.1.
Download original image
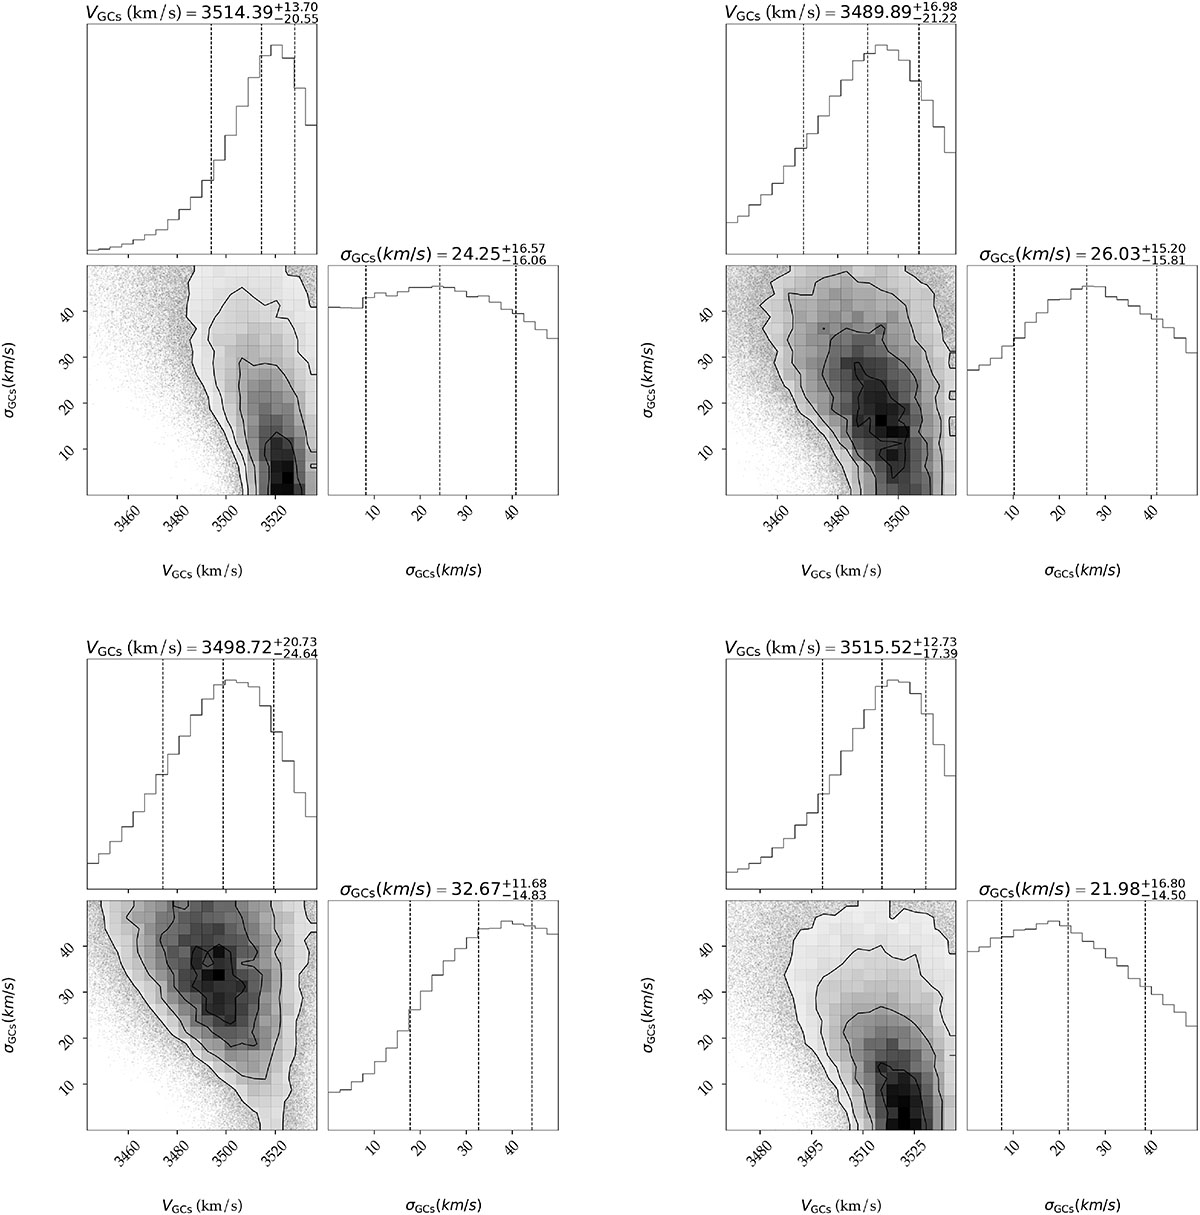
Corner plots showing the results of the MCMC analysis for UDG 11 GC system with one GC excluded in each panel. The upper left, upper right, lower left, and lower right panels correspond to the exclusion of the first, second, third, and fourth GC from Tab. 2, respectively. Each plot displays the posterior probability distributions of the systemic velocity (top), velocity dispersion (bottom right), and their correlation (bottom left).
Current usage metrics show cumulative count of Article Views (full-text article views including HTML views, PDF and ePub downloads, according to the available data) and Abstracts Views on Vision4Press platform.
Data correspond to usage on the plateform after 2015. The current usage metrics is available 48-96 hours after online publication and is updated daily on week days.
Initial download of the metrics may take a while.