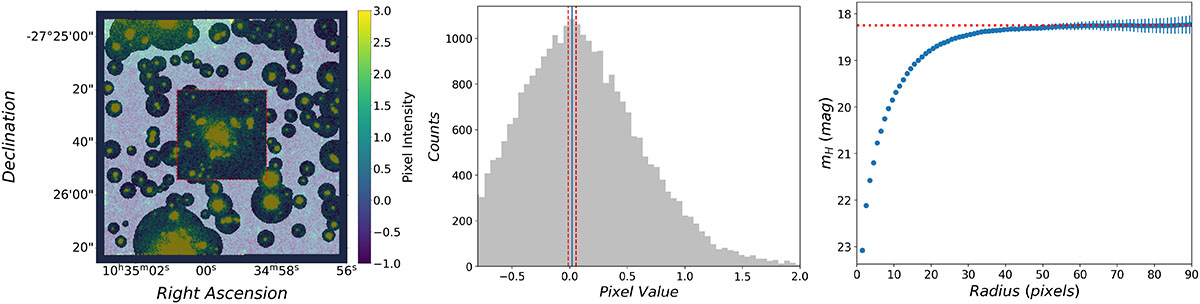
Fig. G.1.
Download original image
Estimate of the total H-band magnitude for UDG 11. Left panel: Darker pixels indicate masked regions. All remaining pixels were used to determine the background level. Central panel: Distribution of the pixels used to estimate the background level. The blue solid line indicates the mode of the distribution, while the red dashed lines show the ±1σ range around the mode. Right panel: Curve of growth obtained from the azimuthally averaged surface brightness profile. The horizontal red dotted line marks the asymptotic value.
Current usage metrics show cumulative count of Article Views (full-text article views including HTML views, PDF and ePub downloads, according to the available data) and Abstracts Views on Vision4Press platform.
Data correspond to usage on the plateform after 2015. The current usage metrics is available 48-96 hours after online publication and is updated daily on week days.
Initial download of the metrics may take a while.