Fig. 6.
Download original image
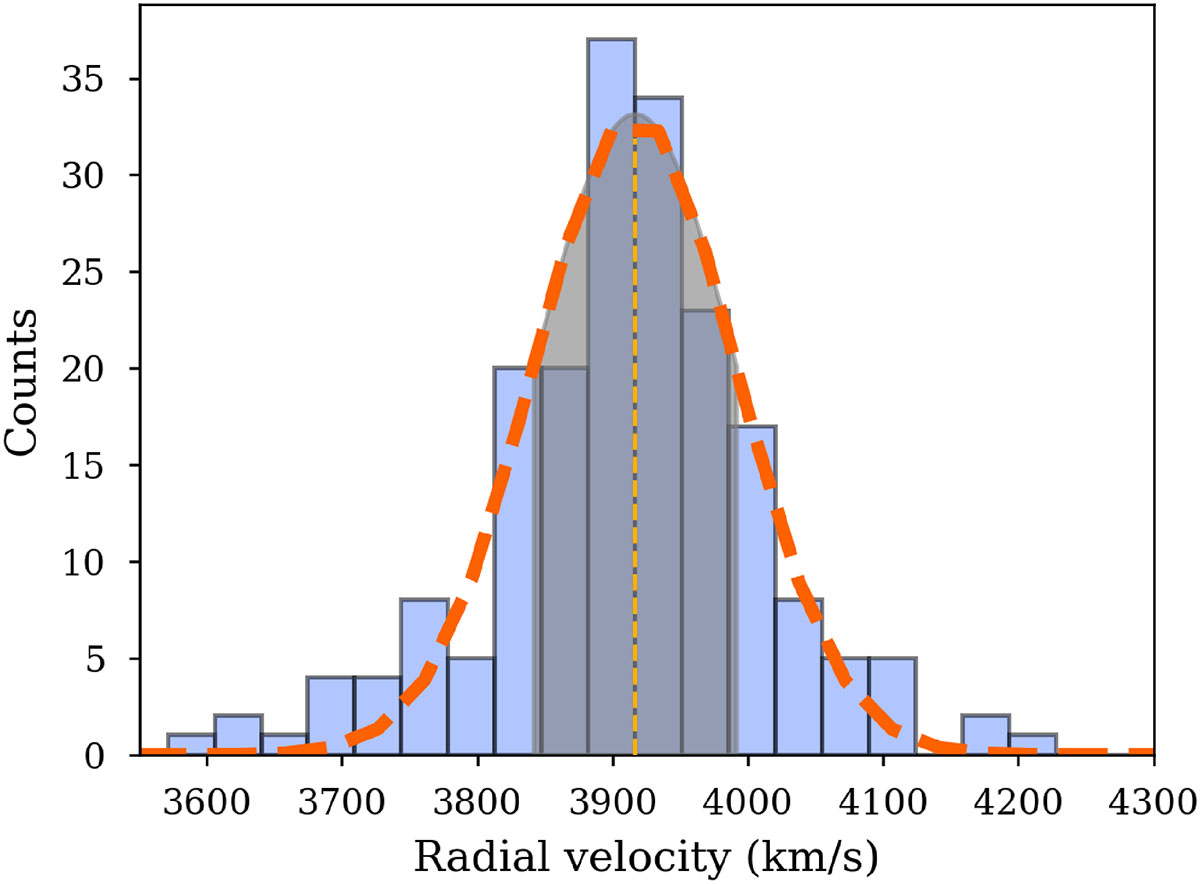
Distribution of radial velocity values derived from the MC simulations, shown as a blue histogram. The dark orange dashed curve represents a Gaussian fit to the distribution. The mean and one standard deviation around the mean are shown as an orange vertical line and shaded region, respectively. These values correspond to the adopted radial velocity and its uncertainty.
Current usage metrics show cumulative count of Article Views (full-text article views including HTML views, PDF and ePub downloads, according to the available data) and Abstracts Views on Vision4Press platform.
Data correspond to usage on the plateform after 2015. The current usage metrics is available 48-96 hours after online publication and is updated daily on week days.
Initial download of the metrics may take a while.