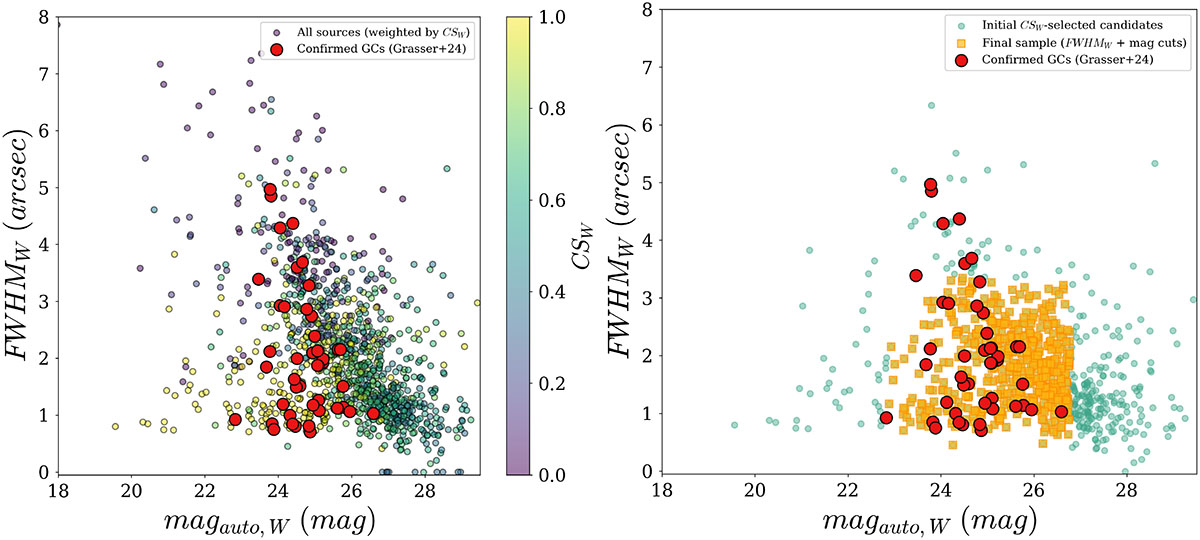
Fig. 7.
Download original image
Selection of sources for constructing the master catalog of GCs. Left panel: FWHMW versus magW for all sources in the three ancillary MUSE fields, weighted by their CSW values. Spectroscopically confirmed GCs from Grasser et al. (2024) are shown as red dots. Right panel: Source selection process. Shown are the initial candidates selected based on the CS parameter (cyan dots), the final sample after applying FWHMW and magnitude cuts (orange squares), and the spectroscopically confirmed GCs (red dots).
Current usage metrics show cumulative count of Article Views (full-text article views including HTML views, PDF and ePub downloads, according to the available data) and Abstracts Views on Vision4Press platform.
Data correspond to usage on the plateform after 2015. The current usage metrics is available 48-96 hours after online publication and is updated daily on week days.
Initial download of the metrics may take a while.