Fig. B.2
Download original image
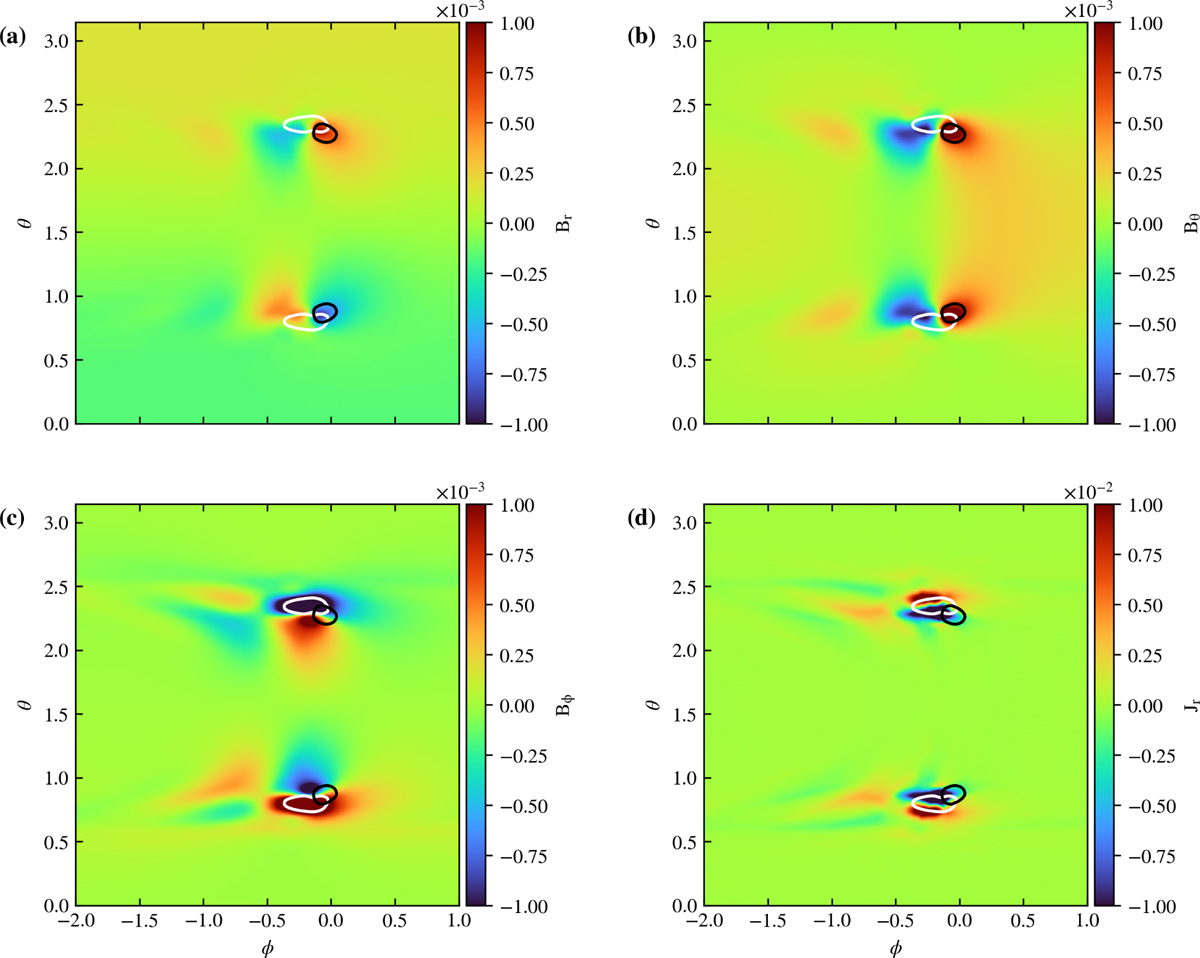
Spatial distribution of magnetic field components and current density on the same integration surface as in Figure B.1. Panels (a), (b), and (c) show Br, Bθ, and Bϕ, respectively. The white contours represent cross sections of constant ![]() , while the black contours denote the region where sr = −1 × 10⁻⁴ in code units. Panel (d) shows the radial current density Jr, with strong current concentrations corresponding to the Alfvén wings.
, while the black contours denote the region where sr = −1 × 10⁻⁴ in code units. Panel (d) shows the radial current density Jr, with strong current concentrations corresponding to the Alfvén wings.
Current usage metrics show cumulative count of Article Views (full-text article views including HTML views, PDF and ePub downloads, according to the available data) and Abstracts Views on Vision4Press platform.
Data correspond to usage on the plateform after 2015. The current usage metrics is available 48-96 hours after online publication and is updated daily on week days.
Initial download of the metrics may take a while.