Open Access
Fig. C.1
Download original image
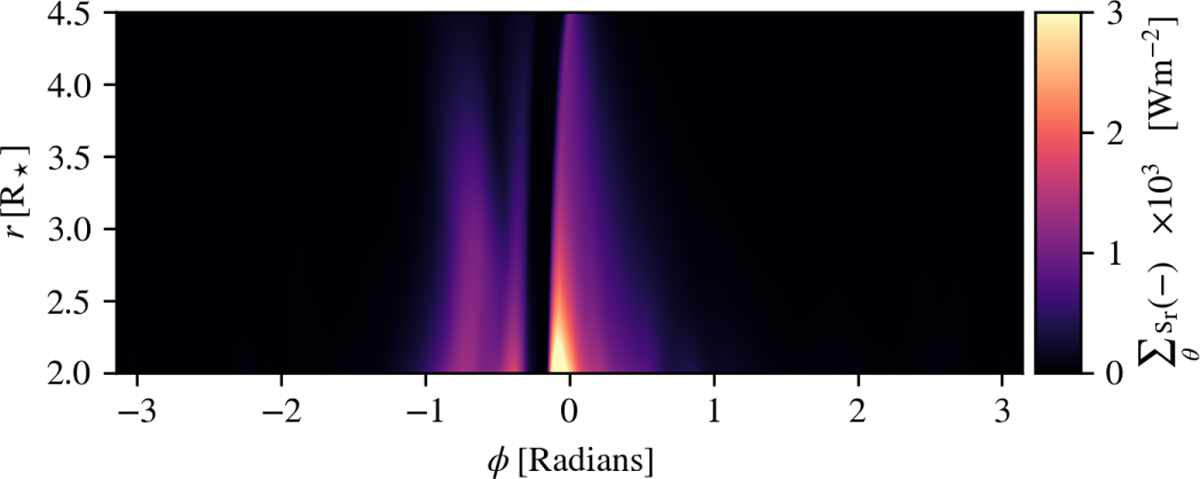
Longitudinal distribution of SPMI power on concentric spherical surfaces centered on the star. The y-axis indicates the radius of these spherical surfaces, while the x-axis shows the longitude. The color scale represents the latitude-integrated sum of the negative (inward-directed) Poynting flux in the northern hemisphere.
Current usage metrics show cumulative count of Article Views (full-text article views including HTML views, PDF and ePub downloads, according to the available data) and Abstracts Views on Vision4Press platform.
Data correspond to usage on the plateform after 2015. The current usage metrics is available 48-96 hours after online publication and is updated daily on week days.
Initial download of the metrics may take a while.