Fig. 3
Download original image
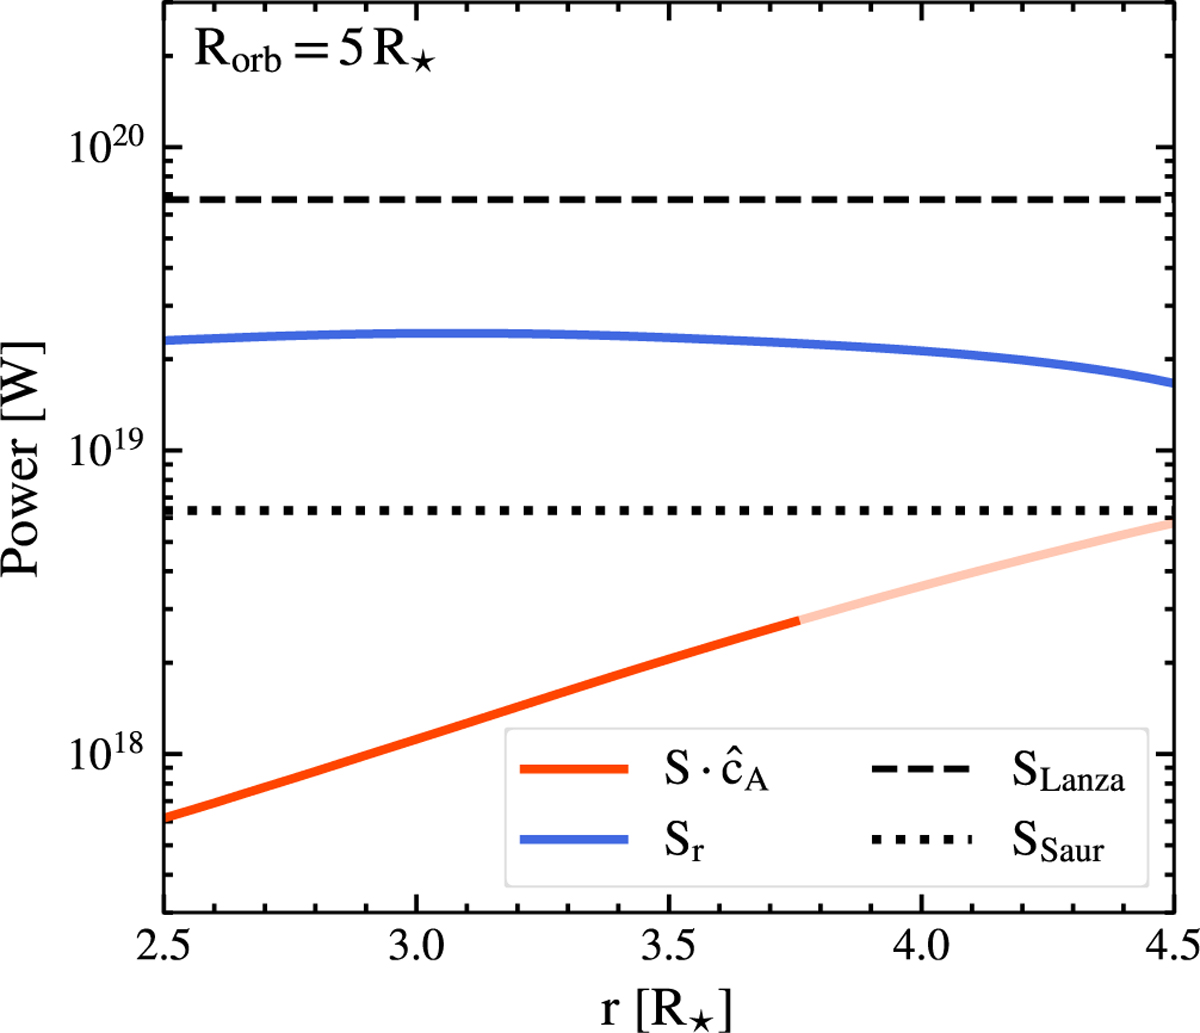
Surface-integrated quantities Sr and ![]() shown as functions of radius for the system with an orbital radius of 5 R⋆. The surface integration is performed over spherical shells of varying radii centered on the star, following the approach illustrated in Figure 1 and using the formulations in Equations (13) and (14). The translucent portion of the solid red
shown as functions of radius for the system with an orbital radius of 5 R⋆. The surface integration is performed over spherical shells of varying radii centered on the star, following the approach illustrated in Figure 1 and using the formulations in Equations (13) and (14). The translucent portion of the solid red ![]() curve corresponds to integration radii where the chosen surfaces are suboptimal for evaluating the integral (see explanation in Appendix A). Consequently, the solid portion of the red curve highlights the range over which the integrated quantity is considered most reliable. The dotted and dashed black horizontal lines represent the corresponding analytical predictions from the Saur and Lanza models, as given by Equations (9) and (10), respectively.
curve corresponds to integration radii where the chosen surfaces are suboptimal for evaluating the integral (see explanation in Appendix A). Consequently, the solid portion of the red curve highlights the range over which the integrated quantity is considered most reliable. The dotted and dashed black horizontal lines represent the corresponding analytical predictions from the Saur and Lanza models, as given by Equations (9) and (10), respectively.
Current usage metrics show cumulative count of Article Views (full-text article views including HTML views, PDF and ePub downloads, according to the available data) and Abstracts Views on Vision4Press platform.
Data correspond to usage on the plateform after 2015. The current usage metrics is available 48-96 hours after online publication and is updated daily on week days.
Initial download of the metrics may take a while.