Fig. 4
Download original image
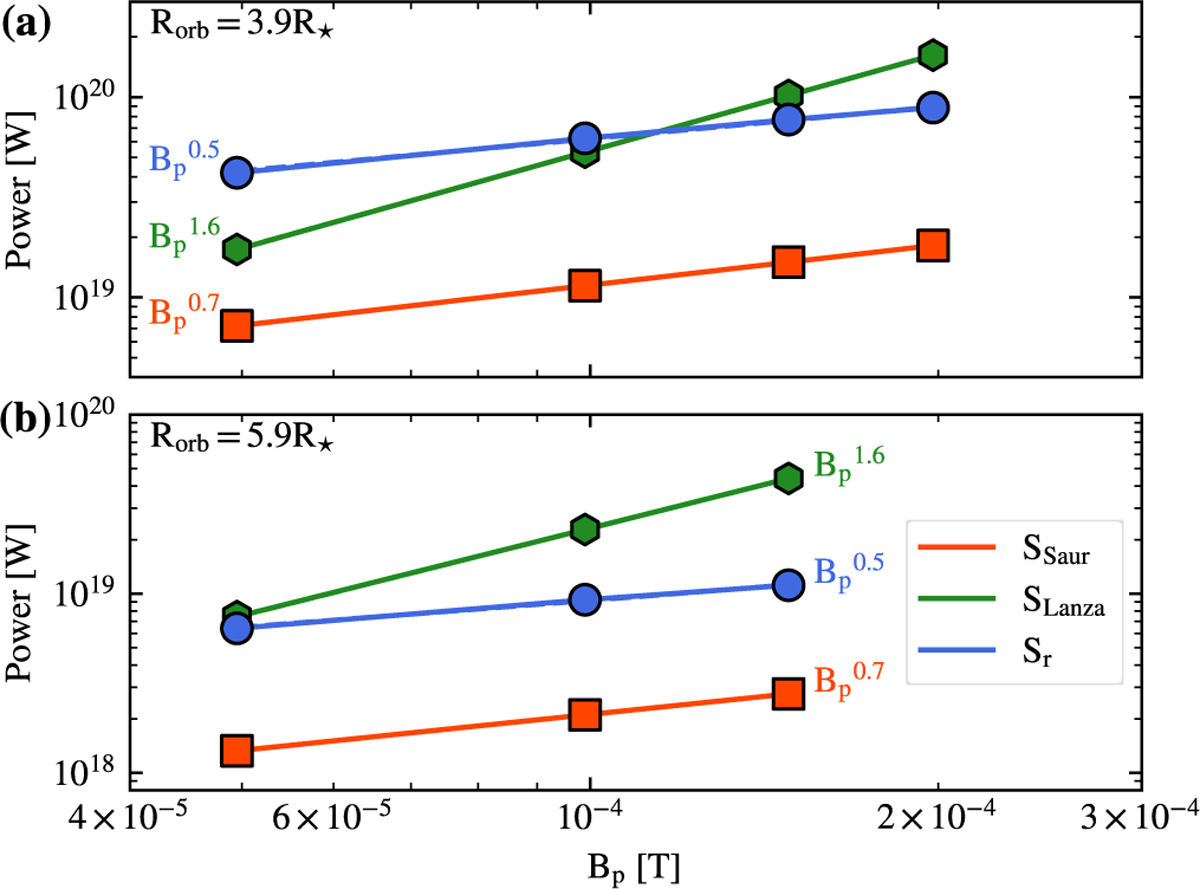
Comparison of SPMI power as a function of planetary magnetic field strength at two orbital radii. Panel a shows the results for Rorb = 3.9, R⋆, and panel b for Rorb = 5.9, R⋆. The scatter points indicate simulation results; the solid lines represent power-law fits. The blue markers and lines denote Sr from simulations, the red squares and lines show the predictions from the Saur model, and the green hexagons and lines correspond to the Lanza model.
Current usage metrics show cumulative count of Article Views (full-text article views including HTML views, PDF and ePub downloads, according to the available data) and Abstracts Views on Vision4Press platform.
Data correspond to usage on the plateform after 2015. The current usage metrics is available 48-96 hours after online publication and is updated daily on week days.
Initial download of the metrics may take a while.