Fig. 6
Download original image
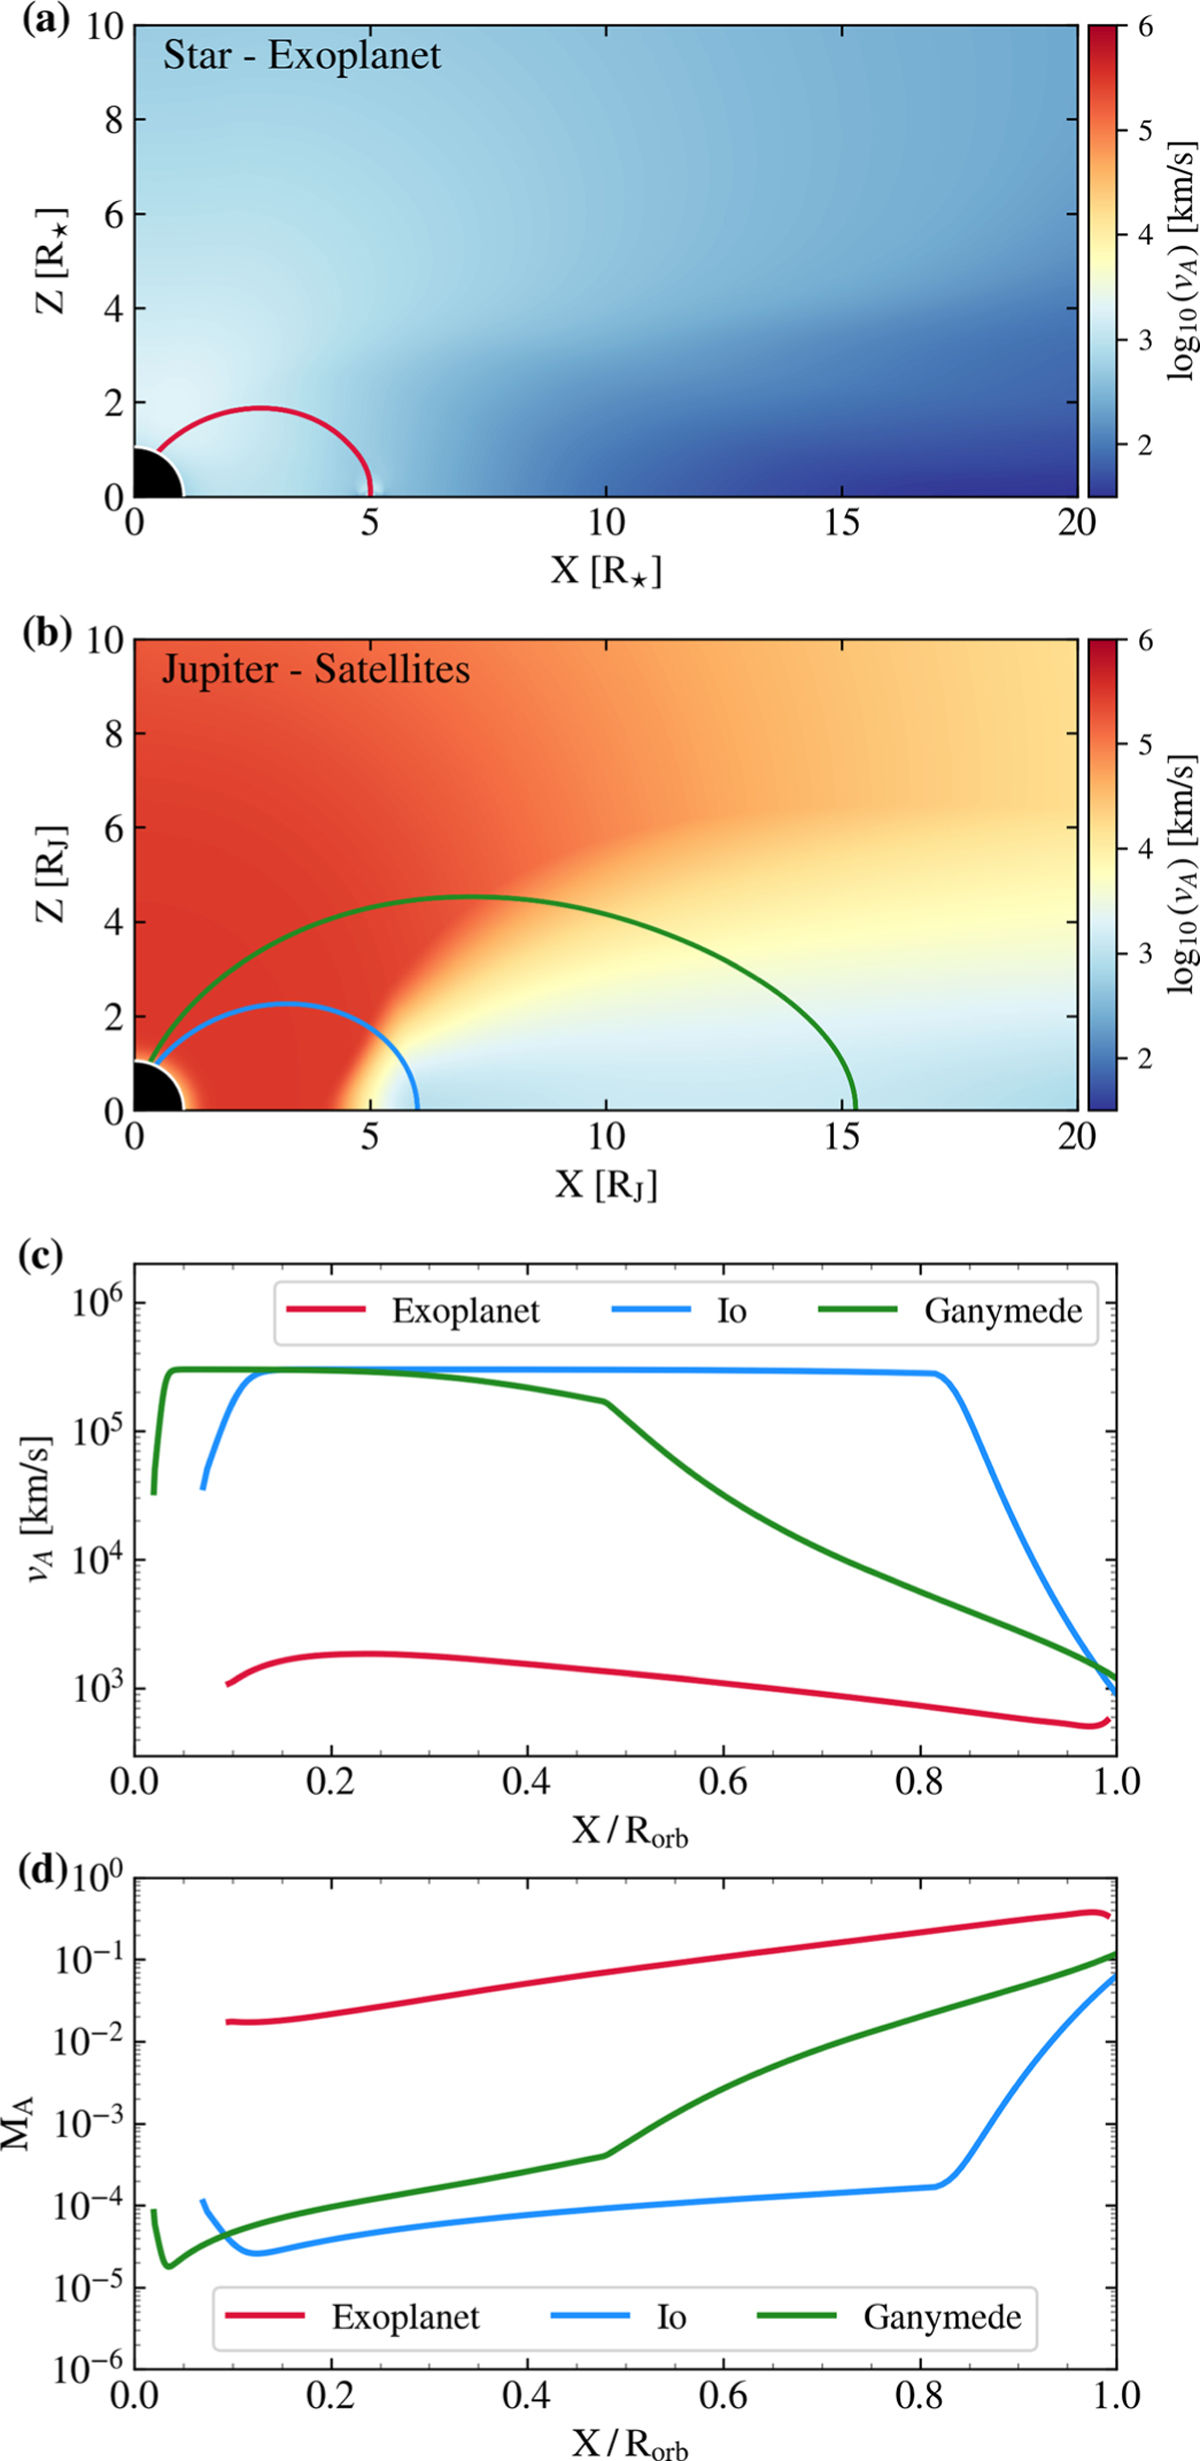
Comparison of Alfvén speed and Alfvénic Mach number profiles in SPMI and the Jovian system. Panel a shows the Alfvén speed distribution in our simulated SPMI system. The red curve traces a magnetic field line from an exoplanet at 5 stellar radii to the star. Panel b presents a meridional slice of Alfvén speed within Jupiter’s magnetosphere, highlighting the localized influence of the Io plasma torus. The blue and green lines mark magnetic field lines traced from the Io and Ganymede orbits, respectively. Panel c plots the Alfvén speed along these field lines and panel d shows the corresponding Alfvénic Mach number profiles along the field lines.
Current usage metrics show cumulative count of Article Views (full-text article views including HTML views, PDF and ePub downloads, according to the available data) and Abstracts Views on Vision4Press platform.
Data correspond to usage on the plateform after 2015. The current usage metrics is available 48-96 hours after online publication and is updated daily on week days.
Initial download of the metrics may take a while.