Fig. 1.
Download original image
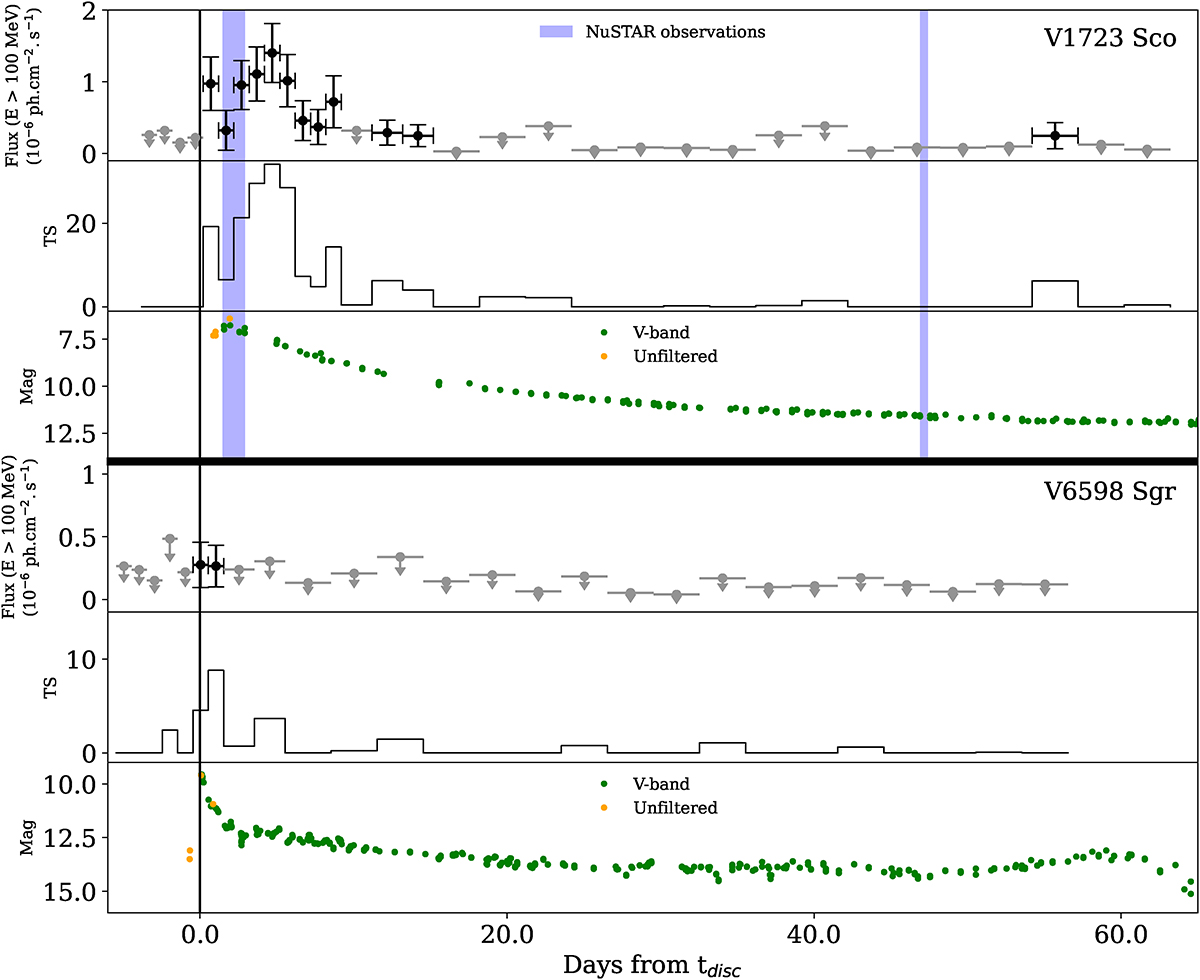
γ-ray and optical light curves of V1723 Sco (top) and V6598 Sgr (bottom) calculated from the Fermi-LAT data (black and gray) and taken from the AAVSO database in the V-band (green) and unfiltered (orange) respectively. Flux estimates with 1σ statistical uncertainties only are plotted when TS and Npred > 4 and 95% upper limits otherwise. The blue windows indicate the time periods of the NuSTAR observations. tdisc corresponds to the optical discovery of both novae (Table 1).
Current usage metrics show cumulative count of Article Views (full-text article views including HTML views, PDF and ePub downloads, according to the available data) and Abstracts Views on Vision4Press platform.
Data correspond to usage on the plateform after 2015. The current usage metrics is available 48-96 hours after online publication and is updated daily on week days.
Initial download of the metrics may take a while.