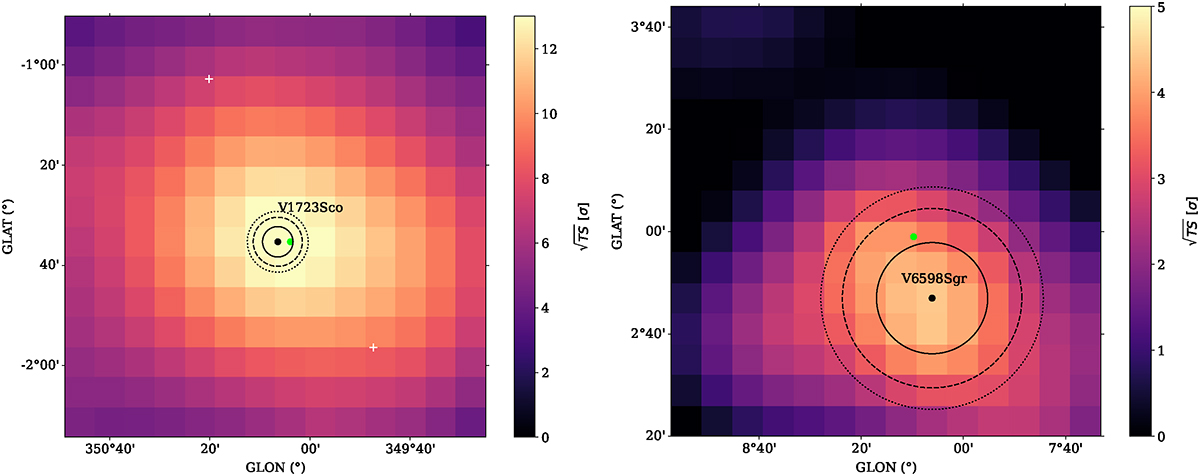
Fig. 2.
Download original image
TS maps of V1723 Sco (left) and V6598 Sgr (right) during the optimal time period (see text). The value in TS is estimated in each pixel by fitting a point source with a power-law model (index fixed to 2). The green point is the optical nova position, the black one is the position found by gta.localize with the 68%, 95% and 99% containment radius. The white crosses are known γ-ray sources from the 4FGL catalog.
Current usage metrics show cumulative count of Article Views (full-text article views including HTML views, PDF and ePub downloads, according to the available data) and Abstracts Views on Vision4Press platform.
Data correspond to usage on the plateform after 2015. The current usage metrics is available 48-96 hours after online publication and is updated daily on week days.
Initial download of the metrics may take a while.