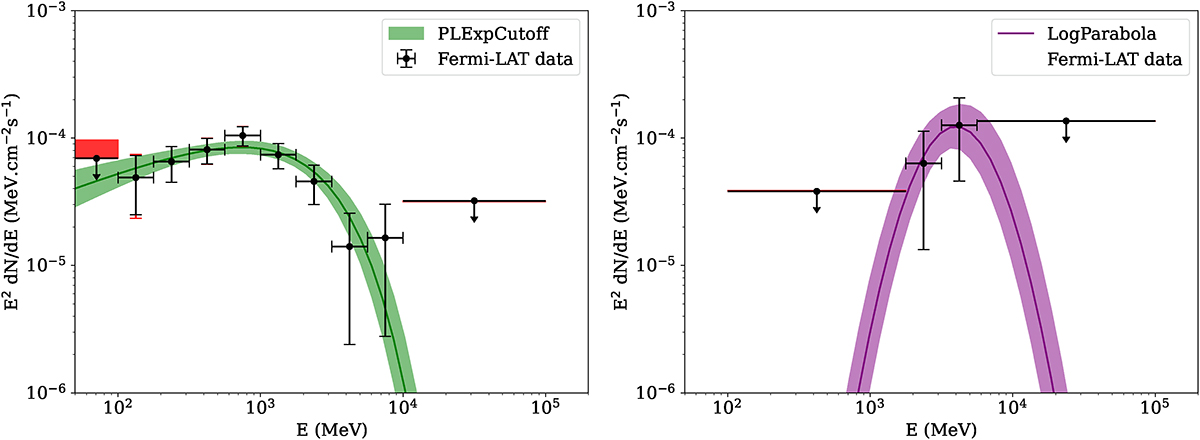
Fig. 3.
Download original image
Spectra of V1723 Sco (left) and V6598 Sgr (right) during the optimal time period (see text). Only the best spectral model and its corresponding uncertainty was represented. Flux points with 1σ statistical uncertainties (black) and the quadratic sum of statistical and systematic uncertainties (red) are plotted when TS and Npred > 2 and 95% upper limits otherwise. Energy bins from the analysis are merged only for the calculation of the flux points.
Current usage metrics show cumulative count of Article Views (full-text article views including HTML views, PDF and ePub downloads, according to the available data) and Abstracts Views on Vision4Press platform.
Data correspond to usage on the plateform after 2015. The current usage metrics is available 48-96 hours after online publication and is updated daily on week days.
Initial download of the metrics may take a while.