Open Access
Fig. 7.
Download original image
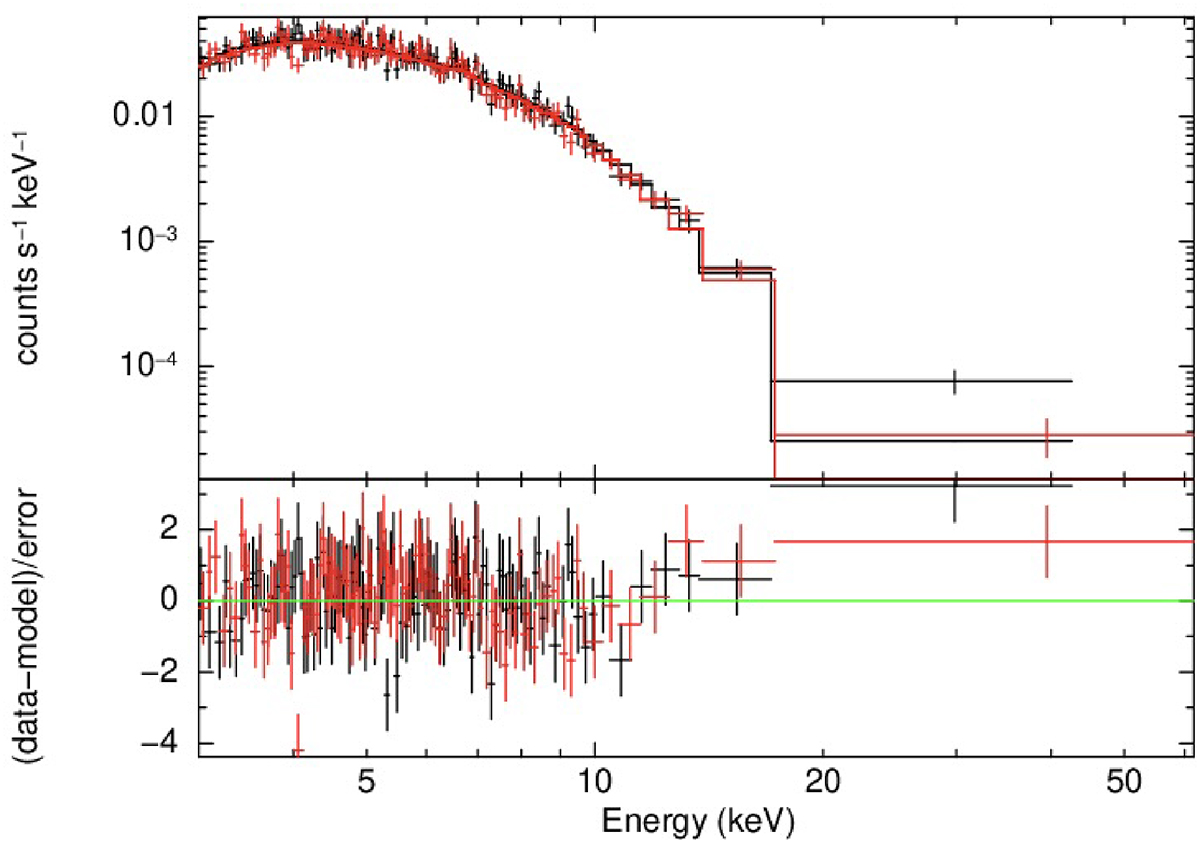
NuSTAR spectrum with best model (see text) of the nova V1723 Sco 47 days after the outburst. The data collected with the focal plane modules A and B are plotted in black and red, respectively.
Current usage metrics show cumulative count of Article Views (full-text article views including HTML views, PDF and ePub downloads, according to the available data) and Abstracts Views on Vision4Press platform.
Data correspond to usage on the plateform after 2015. The current usage metrics is available 48-96 hours after online publication and is updated daily on week days.
Initial download of the metrics may take a while.