Fig. 3
Download original image
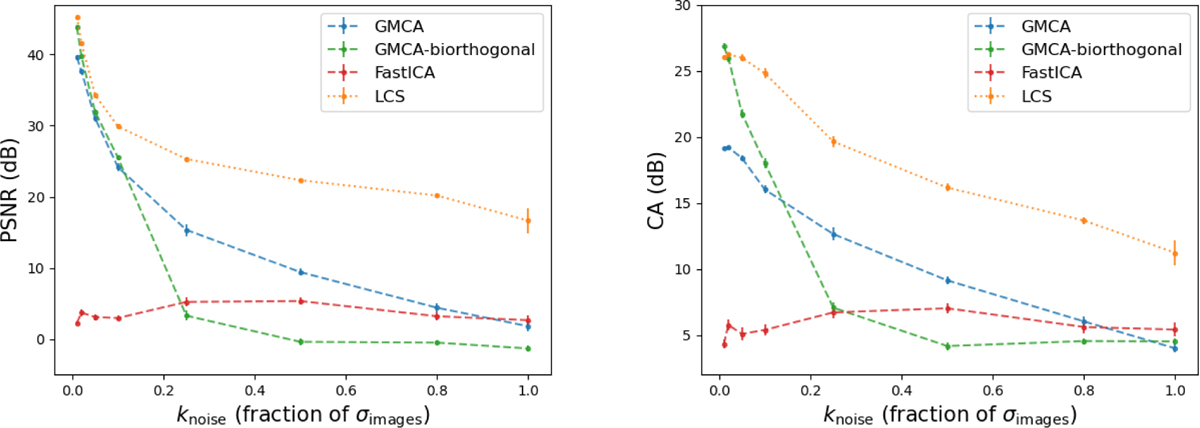
Performance comparison of various BSS methods on standard test images: LCS (orange), GMCA (blue), GMCA-biorthogonal (green), and FastICA (red). Left panel: mean PSNR values on the source matrix (S) as a function of the input noise level (knoise). Right panel: corresponding mean component angle (CA) values on the mixing matrix (A). Each point represents the average and standard error over ten independent realisations of both the mixing mixing matrices (A) and the noise.
Current usage metrics show cumulative count of Article Views (full-text article views including HTML views, PDF and ePub downloads, according to the available data) and Abstracts Views on Vision4Press platform.
Data correspond to usage on the plateform after 2015. The current usage metrics is available 48-96 hours after online publication and is updated daily on week days.
Initial download of the metrics may take a while.