Fig. 10.
Download original image
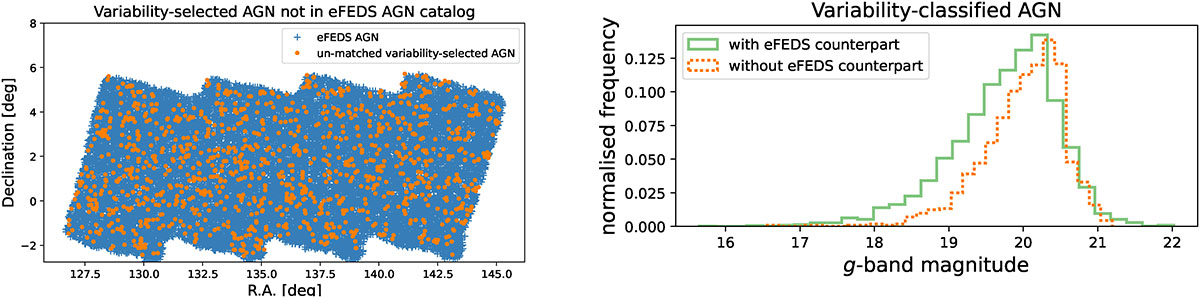
Left panel: Sky location of the eFEDS AGN within the area with over 90% coverage, in blue. Variability-selected AGN candidates that do not match the eFEDS AGN and are within this area are marked in orange. Right panel: Distribution of g-band magnitudes for both sets, where variability-classified AGN in the eFEDS field with a match in the eFEDS AGN catalogue is plotted in green and without a match in orange.
Current usage metrics show cumulative count of Article Views (full-text article views including HTML views, PDF and ePub downloads, according to the available data) and Abstracts Views on Vision4Press platform.
Data correspond to usage on the plateform after 2015. The current usage metrics is available 48-96 hours after online publication and is updated daily on week days.
Initial download of the metrics may take a while.