Open Access
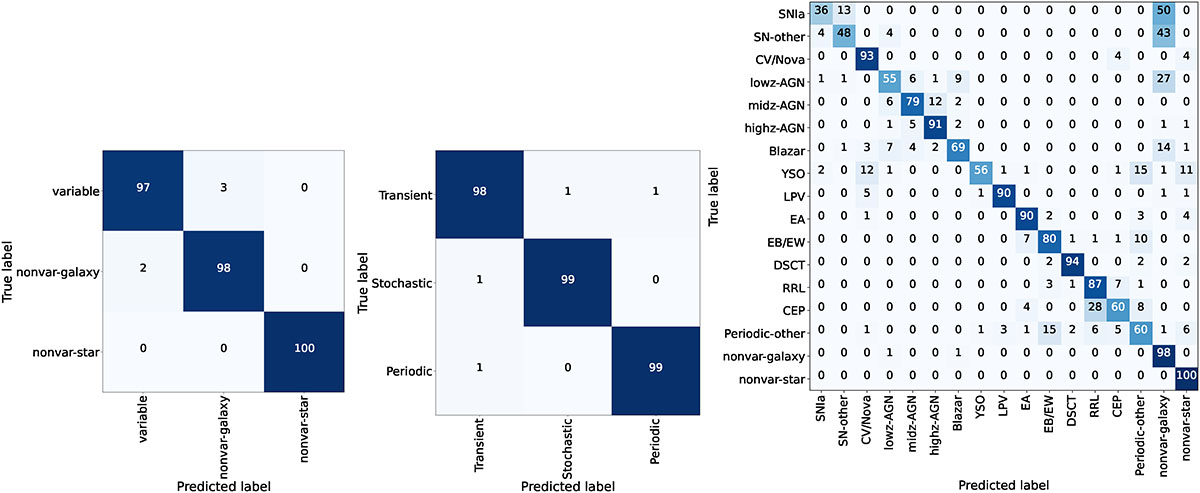
Fig. 3.
Download original image
Confusion matrices of the node_init (left), node_variable (middle), and third level (right) obtained by using the HBRF in the testing set. The confusion matrices show the results as percentages, rounded to integer values, which are computed by dividing each row by the total number of objects with True labels.
Current usage metrics show cumulative count of Article Views (full-text article views including HTML views, PDF and ePub downloads, according to the available data) and Abstracts Views on Vision4Press platform.
Data correspond to usage on the plateform after 2015. The current usage metrics is available 48-96 hours after online publication and is updated daily on week days.
Initial download of the metrics may take a while.