Open Access
Fig. 5.
Download original image
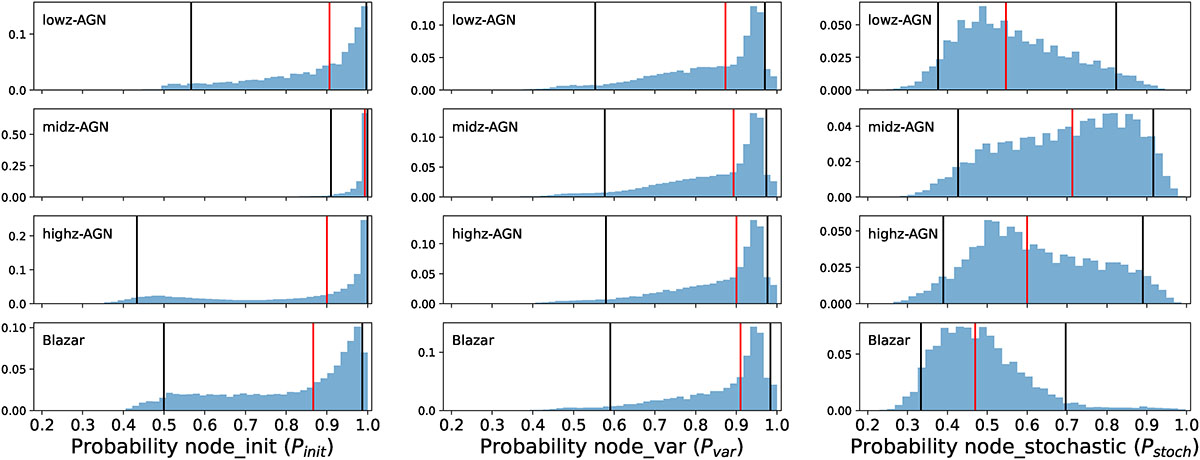
Normalised probabilities of the node_init (left), node_variable (centre), and node_stochastic (right), for the four AGN classes. The red lines show the median probability for each class. The black lines show the 5th and 95th percentiles of the probabilities.
Current usage metrics show cumulative count of Article Views (full-text article views including HTML views, PDF and ePub downloads, according to the available data) and Abstracts Views on Vision4Press platform.
Data correspond to usage on the plateform after 2015. The current usage metrics is available 48-96 hours after online publication and is updated daily on week days.
Initial download of the metrics may take a while.