Fig. 1.
Download original image
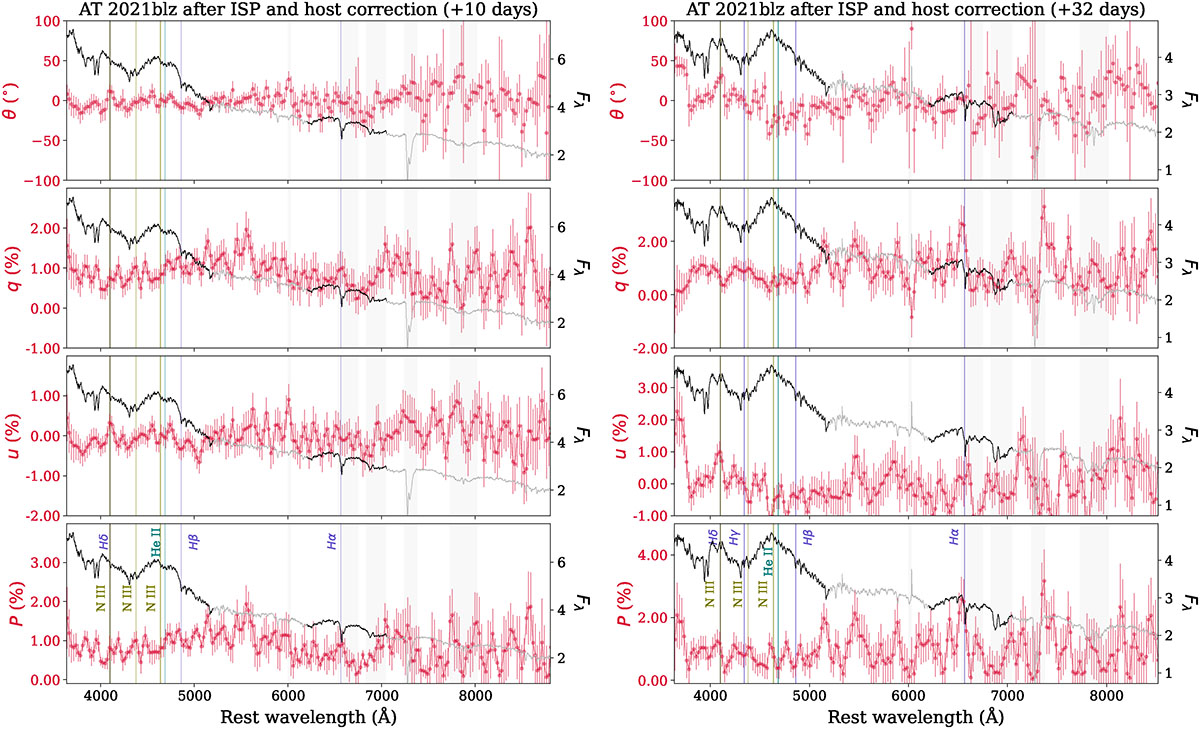
Polarisation spectra of two epochs of AT 2021blz after correcting for the ISP and the host galaxy dilution. In each panel, the left-hand axes refer to the polarisation angle θ; the Stokes parameters q and u; and the polarisation degree P (corrected for the polarisation bias), all shown in red. The right-hand axes refer to the flux spectra at the time of polarimetry (in units of 10−16 erg cm−2 s−1 Å−1), which are shown in black across emission lines and in grey across the assumed continuum. Regions of strong telluric absorption are marked as grey shaded regions. The identified line species are shown as vertical coloured lines: the Balmer lines (dark blue), N III emission lines (olive), and the He II emission line (green).
Current usage metrics show cumulative count of Article Views (full-text article views including HTML views, PDF and ePub downloads, according to the available data) and Abstracts Views on Vision4Press platform.
Data correspond to usage on the plateform after 2015. The current usage metrics is available 48-96 hours after online publication and is updated daily on week days.
Initial download of the metrics may take a while.