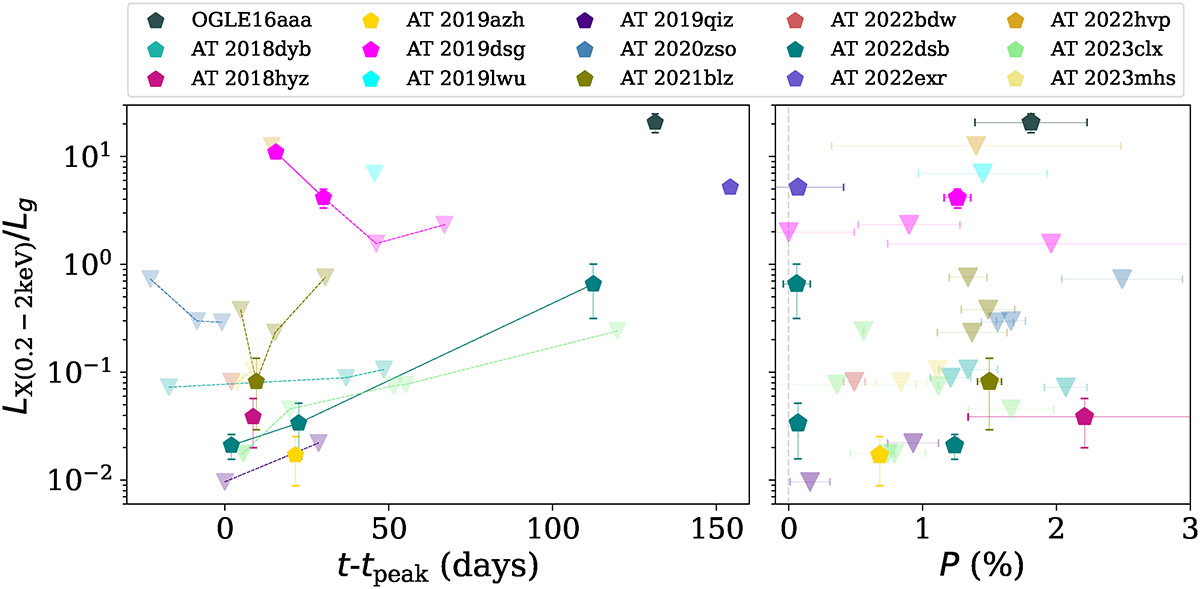
Fig. 10.
Download original image
Relation between the ratio of the 0.2–2 keV X-ray luminosity over the optical g-band luminosity and the polarisation of TDEs. The left-hand panel shows the ratio LX(0.2 − 2 keV)/Lg at the times the polarisation observations of the TDEs were made. Inverted triangles denote (X-ray) upper limits, whereas pentagons mark detections. The right-hand panel shows the ratio LX(0.2 − 2 keV)/Lg plotted against the V-band polarisation.
Current usage metrics show cumulative count of Article Views (full-text article views including HTML views, PDF and ePub downloads, according to the available data) and Abstracts Views on Vision4Press platform.
Data correspond to usage on the plateform after 2015. The current usage metrics is available 48-96 hours after online publication and is updated daily on week days.
Initial download of the metrics may take a while.