Fig. B.1.
Download original image
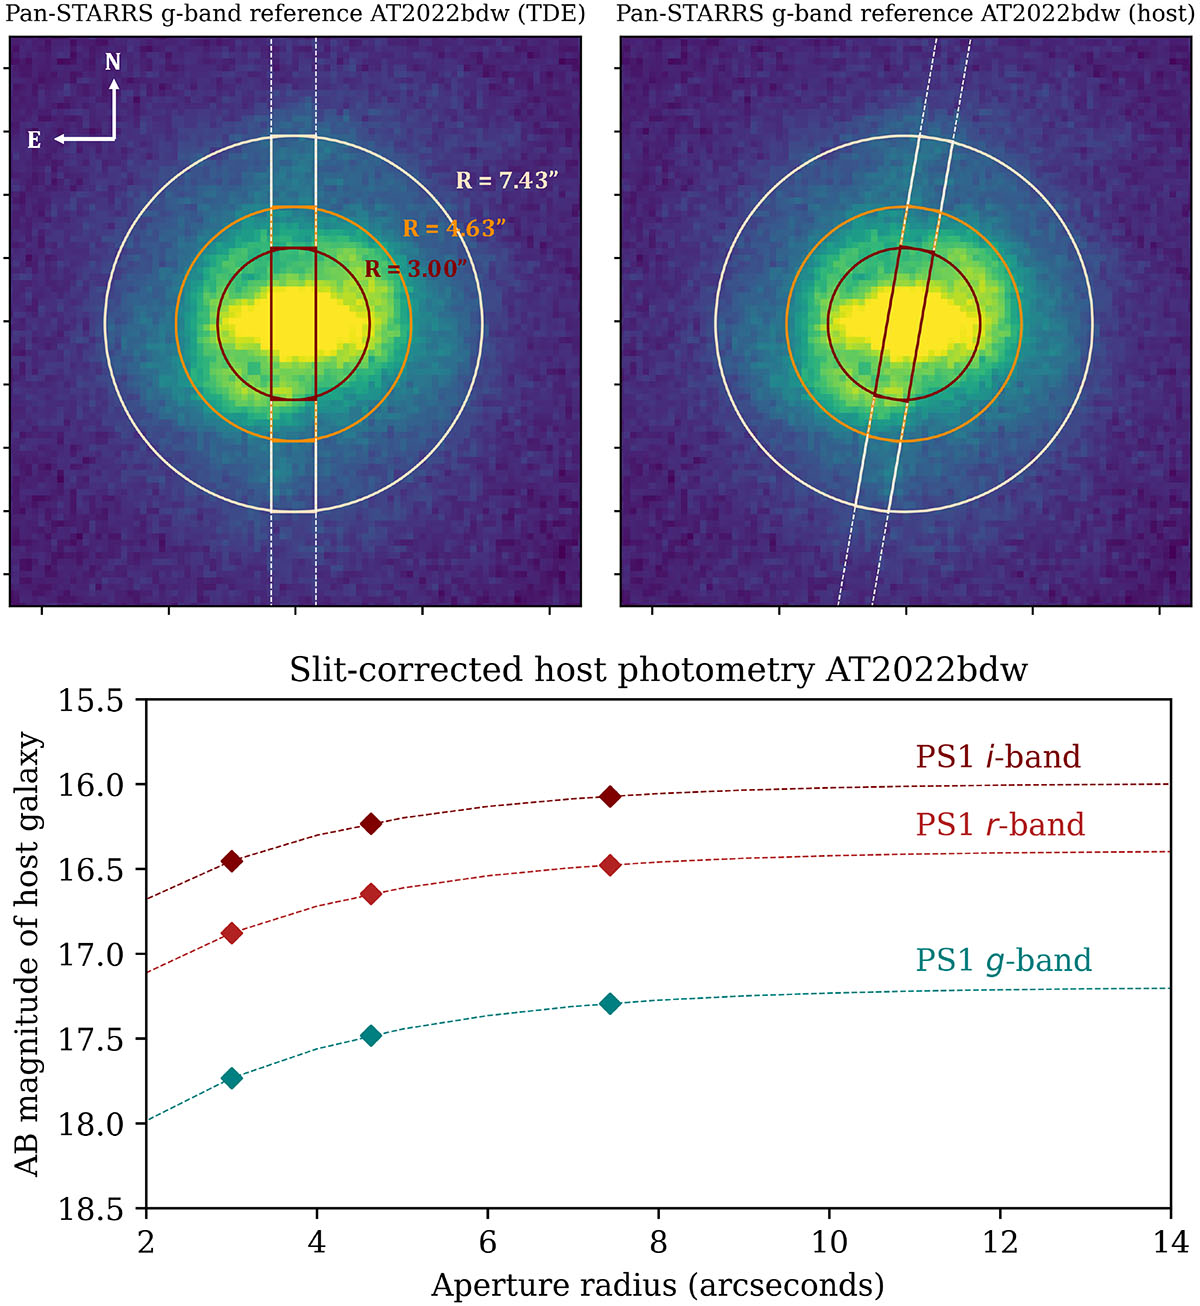
Example of slit-loss correction applied to the host galaxy of AT 2022bdw. The top panels show the g-band PS1 stack image cutout of the galaxy, and overlaid are the rectangular apertures with the same slit position as at the time the TDE spectrum was taken (left) and as at the time the host spectrum was taken (right). Also plotted are the three circular apertures of radii R5, R6, and R7 that were used to calculate a slit ratio: for example, for R5 = 3.00", the slit ratio would be the number of counts in the dark red rectangular aperture divided by the number of counts in the dark red circular aperture. In the bottom panel, we show how the slit-corrected PS1 g, r, i band magnitudes of the host of this TDE increase with circular aperture size, until they reach a plateau as indicated by the dashed lines.
Current usage metrics show cumulative count of Article Views (full-text article views including HTML views, PDF and ePub downloads, according to the available data) and Abstracts Views on Vision4Press platform.
Data correspond to usage on the plateform after 2015. The current usage metrics is available 48-96 hours after online publication and is updated daily on week days.
Initial download of the metrics may take a while.