Fig. 6.
Download original image
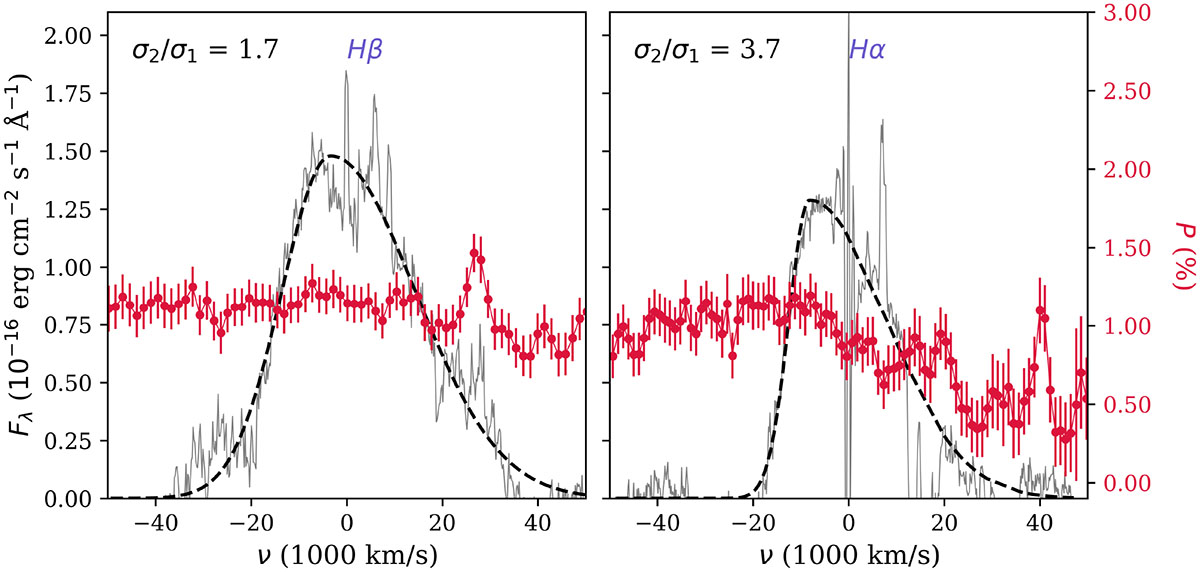
Continuum-subtracted flux spectrum (grey) of AT 2023mhs focussing on the Hα and Hβ, which were fitted with an asymmetric Gaussian function (dashed black lines). The polarisation degree is shown in red. In the upper-left corners, the ratio of the widths σ1 (blue wing) and σ2 (red wing) of the asymmetric Gaussian fit to each line are shown. A ratio σ2/σ1 > 1 for both lines indicates they are asymmetric with more broadened red wings.
Current usage metrics show cumulative count of Article Views (full-text article views including HTML views, PDF and ePub downloads, according to the available data) and Abstracts Views on Vision4Press platform.
Data correspond to usage on the plateform after 2015. The current usage metrics is available 48-96 hours after online publication and is updated daily on week days.
Initial download of the metrics may take a while.