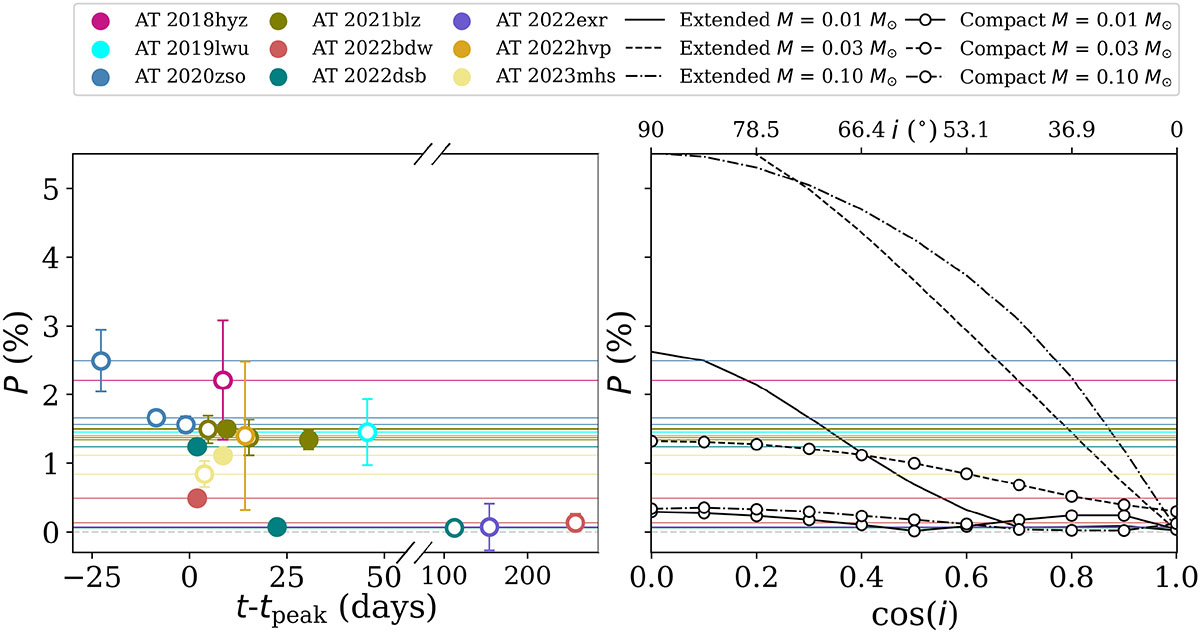
Fig. 8.
Download original image
Comparison of the measured V-band polarisation of TDEs to the predicted polarisation from the super-Eddington disc model (Dai et al. 2018) as first produced by Leloudas et al. (2022). The left panel shows the polarisation as a function of time, similar to Fig. 7 but now only for the TDEs newly analysed in this work. Horizontal lines indicating the polarisation levels are used to guide the eye to the right panel, which shows the model polarisation as a function of the viewing angle relative to the pole. Six models are included with three different disc masses (M = 0.01, 0.03, 0.10 M⊙) and either an extended disc or a compact disc.
Current usage metrics show cumulative count of Article Views (full-text article views including HTML views, PDF and ePub downloads, according to the available data) and Abstracts Views on Vision4Press platform.
Data correspond to usage on the plateform after 2015. The current usage metrics is available 48-96 hours after online publication and is updated daily on week days.
Initial download of the metrics may take a while.