Open Access
Fig. 10.
Download original image
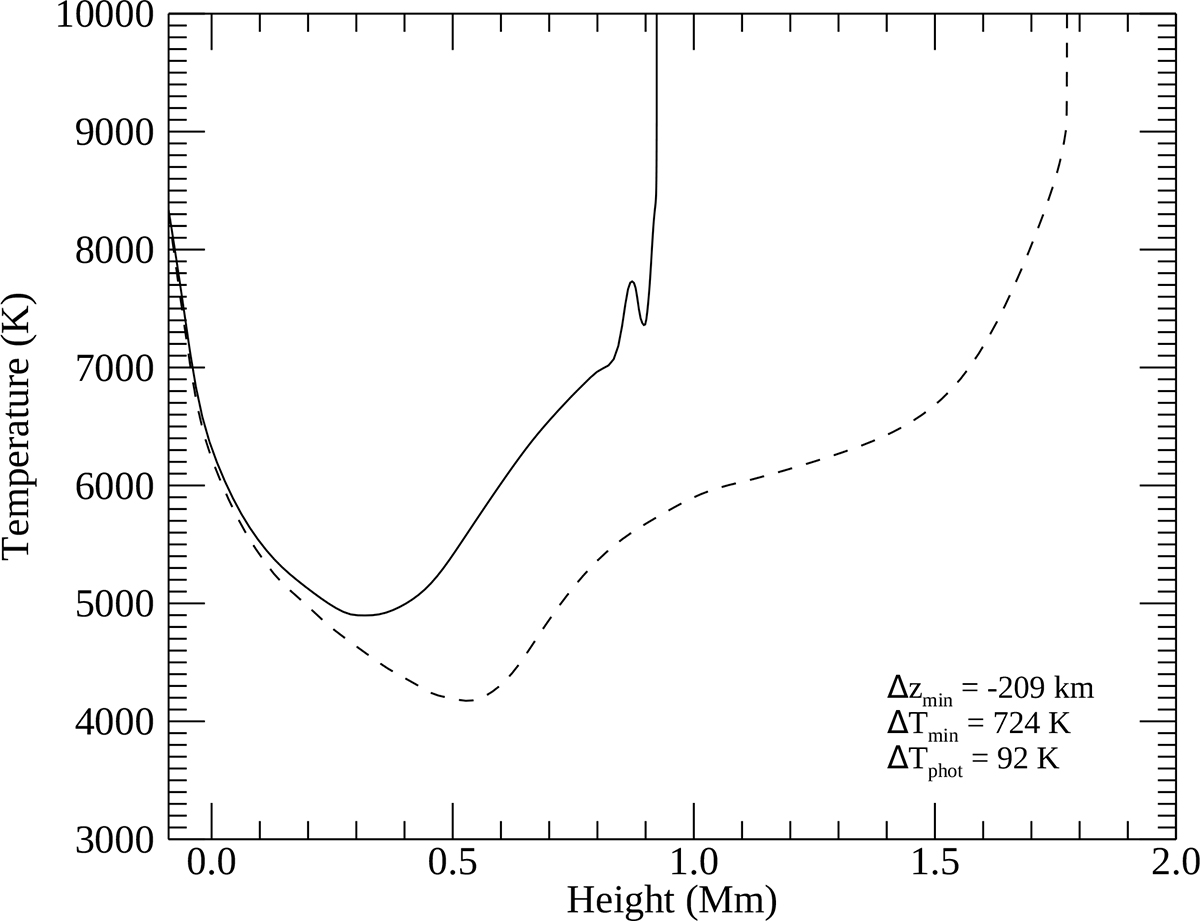
Temperature around the TMR at t = 20.2 s (solid line), i.e., the time of highest temperature in the TMR, and at t = 0 s (dashed line) for case 1. The bottom right indicates the height difference between the TMR at t = 0 s and at t = 20.2 s as well as the temperature differences in the TMR and photosphere at these times.
Current usage metrics show cumulative count of Article Views (full-text article views including HTML views, PDF and ePub downloads, according to the available data) and Abstracts Views on Vision4Press platform.
Data correspond to usage on the plateform after 2015. The current usage metrics is available 48-96 hours after online publication and is updated daily on week days.
Initial download of the metrics may take a while.