Fig. 2.
Download original image
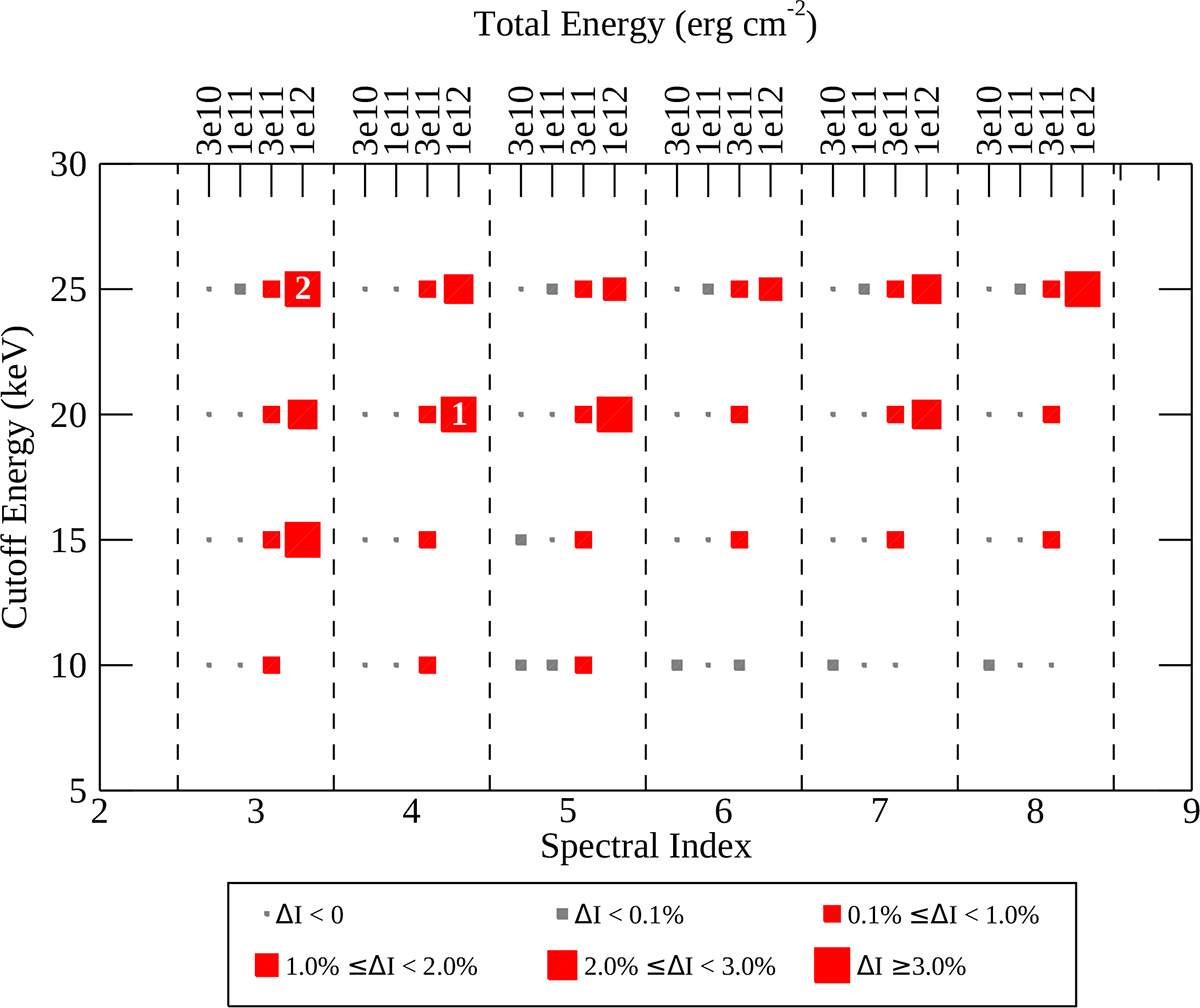
Maximum continuum intensity, Ic, max, as a function of Ec, d, and Etot for all simulations included in the F-CHROMA grid. The values for d have been divided into four distinct locations to avoid overlap and to show Etot corresponding to each simulation (indicated at the top). Dashed vertical lines indicate the border between the different spectral index values. The size corresponds to Ic, max, as indicated in the legend below the x-axis. Red indicates WL cases, whereas gray specifies non-WL cases. The cases used for the case studies are indicated with numbers 1 and 2.
Current usage metrics show cumulative count of Article Views (full-text article views including HTML views, PDF and ePub downloads, according to the available data) and Abstracts Views on Vision4Press platform.
Data correspond to usage on the plateform after 2015. The current usage metrics is available 48-96 hours after online publication and is updated daily on week days.
Initial download of the metrics may take a while.